"A New York Treasure" --Village Voice

Blog Archives

Older posts            Newer posts

Color By Numbers: Youk Got What I Need

If the opposition has the Yankees seeing red tonight, you really can’t blame them. When the White Sox take the field at Yankee Stadium, their lineup will include Kevin Youkilis, the latest rivalry castoff from the Red Sox whose .942 OPS against the Bronx Bombers is one highest in the long running feud between Boston and New York. However, Chicago didn’t acquire Youkilis before their series in the Bronx just so they could antagonize the Yankees. Rather, GM Kenny Williams jumped at the opportunity to fill one of the most cavernous holes on a major league roster. That he was able to do so with a three-time All Star was icing on the cake.

Best and Worst by Position, 2012

*DH excludes National League teams.
Note: Player in parenthesis has most plate appearances at the position.
Source: fangraphs.com

Other than catcher for the Oakland Athletics, no position has been more undermanned from an offensive standpoint than third base on the South Side. Before Youkilis was acquired, the combination of Brent Morel, Orlando Hudson, and Eduardo Escobar turned the position into the cold corner, so even with a hot start (5 for 12) by the former Red Sox’ star, it will take some time before the team’s woeful production from third base starts to thaw out.

Now that the White Sox have filled their deepest hole, the onus shifts to the Detroit Tigers, who have frittered away the benefits of having sluggers like Miguel Cabrera and Prince Fielder by giving away outs from two positions on the diamond. In order to keep up with the White Sox, who currently reside in first place in the A.L. Central, Detroit may also need to make a deal. As the trade deadline nears, the Cubs are expected to hold a fire sale, so, who knows, the answer to the Tigers’ troubles may also reside in Chicago?

For the most part, the primary player who has helped their team lead the league in offense at each position also happens to be in line for an All Star Game start (who says the fans don’t know how what they’re doing?), leaving only Jed Lowrie and Carlos Ruiz as mild surprises. It’s also interesting to note that no team has enjoyed top production from more than one position, which speaks further to the level of parity that currently exists in the game. In the past, a team like the Yankees would dominate the “best list”, but these days, the Bronx Bombers are more of a streamlined offense. Other than second base, the Yankees only rank in the top-five at shortstop, even though they have maintained above average production at every position but left field and catcher.

Yankees’ Relative Production at Each Position, 2012

*DH excludes National League teams.
Source: fangraphs.com

Thanks to the revised postseason structure, the period leading up to the trade deadline promises to be unique, if not active. With so many teams now contenders because of the added wild card, buyers could wind up outnumbering sellers, making the cost of a trade increasingly prohibitive. By striking early, however, the White Sox were able to take advantage of extenuating circumstances in Boston to address their greatest needed without paying too high of a price (or, according to some, any price at all). Because of how well Youkilis has performed against the Yankees, fans of the team may rue the White Sox good fortune over the next four days, but with 15 games left against the Red Sox, the Bronx Bombers could also wind up being one of the early winners of the trading season.

Color By Numbers: Going Streaking

The Yankees hope to start a new winning streak against the Mets at Citi Field.

The Yankees entered yesterday’s off day in unfamiliar territory: on a losing a streak. It had been almost a full month since the Yankees last lost consecutive games, so you can bet the Bronx Bombers will be chomping at the bit to get back in the win column tonight at CitiField.

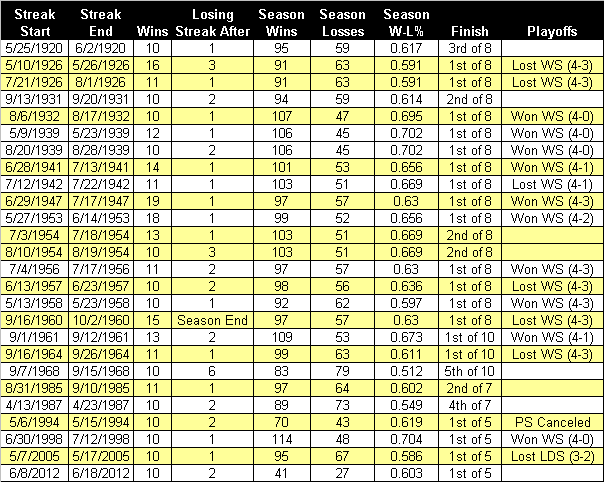
Over the first three months of the season, the Yankees have had seven stretches featuring consecutive losses, but none has lasted longer than three games (three have been two games and four have been three games). Even when they weren’t playing particularly well, the Yankees managed to avoid the kind of long losing streak that can put a team deep in the hole. As a result, the Yankees recent hot stretch has allowed them to build a lead instead of chip away at a deficit.

Distribution of Yankees’ Losing Streaks, Since 1918

Note: Includes all streaks of three or more losses.
Source: Baseball-reference.com

The last time the Yankees avoided a losing streak of at least four games was 1980. Probably one of the most overlooked teams in franchise history, Dick Howser’s club won 103 games that year, but all was forgotten when they were swept by the Royals in the ALCS. Ironically, the Yankees had only lost three games in a row on three occasions during the regular season, just once more than the lowest total in franchise history. Unfortunately for Howser, the team’s fourth three-game losing streak came at an inopportune time as it not only denied him a chance to manage in the World Series, but also wound up costing his job.

It’s a good thing the Yankees have avoided losing streaks in June because, over the first two months of the season, they were on pace to rank near the bottom in terms of both the number of losing stretches and games contained therein. Since 1918, 26 different Yankees’ teams have finished the year with four or fewer losing streaks of at least three games, which puts this season’s current total in perspective. Pro-rated over the entire season, the 2012 Yankees would still fall toward the bottom quintile in both catgeories, which illustrates the extent to which the team sputtered in April and May.

Yankees’ Top-10 and Bottom-10 Total Streak Losses, Since 1918

Note: Totals are the sum of losses that are a part of distinct losing streaks of three or more games in one season.
Source: Baseball-reference.com

Tomorrow night against the Mets, the Yankees will be seeking to avoid another three-game losing streak. After winning at least 10 in a row for only the 26th time in franchise history, the last thing the Yankees want to do is start ceding some of the ground they gained by following up that stretch with a string of losing. Over the years, the Yankees have done a good job of avoiding a winning streak hangover, so history seems to be in their favor. Not only has the team gone 14-11 after having a long winning streak snapped (one streak came at the end of the season), but on only three occasions did the Bronx Bombers lose three or more games in a row.  Is that a good omen heading into the Subway Series? Perhaps, but having Andy Pettitte on the mound doesn’t hurt either.

Yankees’ Season Record in Years with and Number of Losses Immediately Following a 10-Game Winning Streak, Since 1918

Source: Baseball-reference.com

Another good sign is the amount of success enjoyed by Yankees’ teams that have won at least 10 games in a row during a season. The 23 different Bronx Bomber ballclubs to record such a lengthy stretch of winning (three teams had two 10-plus game winnings streaks in one season) have posted a combined winning percentage of .628, and all but six wound up finishing the year in first place (four of which still won at least 94 games). The only real outlier in the group was the 1968 team, which won 10 in a row in September. Unfortunately, it was too little too late as the winning streak only pulled the Yankees to within 16 games of first place. Besides, even had they been closer in the standings, losing six in a row and nine of 10 immediately thereafter would have been the final nail anyway. At the very least, the 10-game winning streak helped the 1968 club finish above .500, thereby avoiding a share of the franchise record of four consecutive losing seasons.

Even the very best baseball teams lose 30%-40% of their games, but the ones who enjoy the most success seem to spread them out evenly over the season. Although the long stretches are the ones that gain the most notoriety, streaks of three and four games can really take a toll. The 2012 Yankees probably won’t become the fourth team in franchise history to have two 10-game winning streaks in one season, but if they can avoid those smaller losing streaks, another division title could be in the offing.

Color by Numbers: Keeping Score of Cain’s Perfection

Photo: Getty Images

It’s hard to be better than perfect, but last night, Matt Cain was just that. Not only did the Giants’ right hander throw the 22nd perfect game in baseball history (and first in franchise history), but he also tied Sandy Koufax for the most strikeouts while doing so. What’s more, Cain’s game score of 101 matched Koufax and Nolan Ryan for the best mark ever posted in a no-hitter of any kind.

Most Strikeouts in a No-Hitter or Perfect Game

*Denotes perfect game.
Source: Baseball-reference.com

By joining Koufax and Ryan with a game score of 101, Cain’s masterpiece takes a back seat to only Kerry Wood’s remarkable rating of 105. Then 20-years old, the Cubs’ phenom accomplished the feat on May 6, 1998, when he struck out 20 Houston Astros, the same franchise Cain dominated to make history last night. Although Cain’s perfection fell shy of Wood’s record, his performance was still only the 10th game score of 100 or greater in nine innings since 1918, making that accomplishment even rarer than the perfect game itself (the highest game score ever recorded is 153, by Joe Oeschger in an epic 26-inning affair).

100-Plus Game Score Club, Since 1918

*Denotes perfect game.
Source: Baseball-reference.com

No one should be surprised by Cain’s brilliant outing. After all, the right hander has now authored two of the top game scores this season. For those less inclined to trust esoteric statistics, Cain had previously thrown three complete game one-hitters, so maybe a no-hitter was just a matter of time?

Matt Cain’s Top-10 Game Scores

Source: Baseball-reference.com

Now that he has thrown one of the best nine inning games in baseball history, what will Matt Cain do for an encore? History hasn’t been very kind to perfect game pitchers in their next start, but after last night’s performance, for Cain, the exceptional might be the new rule.  Maybe he’ll join Johnny Vander Meer as the only pitcher to throw consecutive no-hitters? Or, perhaps, he’ll break Mark Buehrle’s record of 45 consecutive batters retired (dating back to his previous start, Cain has retired 32 batters in a row)? The Angels are next up on the schedule, so they should consider themselves forewarned.

Yanks Beat Rays Behind Better Nova

After struggling in his last start against the Angels, Ivan Nova repeatedly talked about needing to get better. It didn’t take him long to fulfill that promise. Following in the footsteps of Phil Hughes and Andy Pettitte, Nova turned in one of the best games of his career and completed only the Yankees’ second turn through the rotation with consecutive quality starts.

When Desmond Jennings singled to lead off the first inning, there were probably more than a few groans throughout the crowd, but that turned out to be the last hit Nova would allow until Sean Rodriguez’ double in the eighth. In between, Nova allowed only two other base runners, as the right hander kept the Rays off balance with a mix of fastballs, sliders, and curves, all of which he was able to throw for strikes.

The Yankees needed Nova to be strong because Rays’ right hander Alex Cobb was nearly as good. Over his first seven innings, the 24-year old starter limited the Yankees to two hits, but each one left the ballpark. In the second inning, the Yankees jumped ahead 1-0 when Mark Teixeira circumvented the shift by sending a curveball deep into the second deck of the right field stands. Two innings later, Robinson Cano doubled the Yankees lead by hitting a wall scrapper that didn’t go nearly as far but counted just the same. The blast came right after Alex Rodriguez was picked off first by Jose Molina, but the forfeited run proved inconsequential.

In the bottom of the eighth, the Yankees tacked on two more runs when Raul Ibanez, Nick Swisher and Eric Chavez recorded consecutive hits, knocking Cobb from the game in the process. Even before the Yankees extended their lead, Joe Girardi seemed committed to giving Nova a chance for a complete game shutdown, but the extra runs made the decision even easier. The cushion also saved Girardi from being second guessed when the Rays greeted Nova with back-to-back triples to start the ninth. However, all questions were rendered moot by Rafael Soriano, who quickly restored order by striking out the next two batters before retiring old friend Hideki Matsui on a deep fly ball to right.

With the victory, the Yankees leap-frogged the Rays into second place, a position they haven’t occupied since April 24. The win also pushed the Yankees’ record to seven games over .500 for the first time all season and set the stage for a series sweep. Perhaps even more important than the season milestones, however, the outcome was also a shot in the arm for Nova, who proved he could be better…at least for one night.

Color by Numbers: Loaded Questions

What would the Yankees’ record be if their performance with runners in scoring position was on par with recent seasons? With a few key hits at the right moment, the Yankees could be resting comfortably in first place, but so far this season, the team hasn’t been able to land the big blow with the same amount frequency. And, in no situation has that been more evident…and costly…than when the Yankees have loaded the bases.

Yankees Offensive sOPS+ Rates, 1996-2012

Note: sOPS+ compares a team’s split to the adjusted average for the major leagues. A reading above 100 is considered above average for an offense.
Source: baseball-reference.com

Entering play on Wednesday, the Yankees ranked near the bottom of the major leagues in terms of batting average, on-base percentage, and slugging (.151/.222/.302) with the bases full. Based on OPS, not only does that performance rate fail to attain even 50% of the major league average, but it also ranks as the franchise’s third lowest output since 1948. Also, the differential between the team’s overall offensive production and its performance with the bases loaded is currently larger than at any point over the same timeframe.

Clearly, the Yankees have been laggards with the bases loaded, but is this really a bad harbinger? Based on correlation from 1996 to now, the Yankees’ performance with the bases loaded has only been moderately related to overall run production as a percentage of the league average (r=.62).  Meanwhile, the link between relative runs scored and OPS with men in scoring position has been more significant (r=.78). So, if anything, fans who are inclined to worry should focus their concerns on the more broad number.

Yankees’ Bases Loaded vs. Overall OPS, 1948-2012
 

Source: baseball-reference.com

It hasn’t been all bad news for the Yankees with the bases loaded. While the hitters have struggled in such situations, the pitching staff has done a good job wiggling out of trouble when the bags are jammed. In 42 plate appearances with the bases loaded, opposing hitters have produced at rates of .263/.262/.368 (sOPS+ of 76), including 13 strikeouts and only one walk. It might only be a small consolation, but at least Yankees’ pitchers have been able to offset some of the offense’s missed opportunities by imposing the same frustration on the opposition. Unfortunately, since 1996, there has been no correlation between the Yankees’ ability to limit the damage in bases loaded situations and prevent runs overall (r=.04), so there doesn’t seem to be much benefit from that guilty pleasure.

Yankees Pitching sOPS+ Rates, 1996-2012

Note: sOPS+ compares a team’s split to the adjusted average for the major leagues. A reading below 100 is considered above average for a pitching staff.
Source: baseball-reference.com

An optimist probably looks at the Yankees’ ability to hang around first place despite its offensive struggles with runners in scoring position as a positive sign. Meanwhile, the pessimist might consider the offense’s inefficiency to be a systemic problem that will prevent the team from outscoring the deficiencies of the starting rotation. Which side are you on? I take a little from both. The lineup’s track record suggests the Yankees’ offense will soon start making up ground on the past, but it won’t matter if they can’t stay ahead of the current opposition. A few more hits with the bases loaded would definitely be nice, but the real loaded question is whether the pitching staff can ensure that those runs will be meaningful when they finally cross the plate.

Color By Numbers: Hare Today, Playoffs Tomorrow

The Yankees head into a much needed off day on a two-game winning streak, but the team still finds itself in fourth place with a disappointing  23-21 record. A four game deficit in the loss column is hardly insurmountable, especially in May and particularly when the division leader has been a perennial loser for the last 14 years, but there are still some signs of caution evident in the Yankees’ relatively slow start.

Most Yankees’ fans probably have little doubt that the Bronx Bombers will soon overtake the first place Baltimore Orioles, but history suggests that the O’s chances of sustaining their fast start are actually pretty good. Regardless, the bigger question for the Yankees is will they be able to flip the switch and play at a much higher level for the remainder of the season. According to the franchise’s historical record, the road to the playoffs has been paved with a fast start, so this year’s team certainly has its work cut out.
Considering the 2011 Yankees started out 24-20 and still went onto win 97 games, this year’s slow start by franchise standards (70% of Yankees’ teams began with a better record over the first 44 games) hasn’t really caused a panic. However, it’s worth noting that last year was more of an exception than the norm. Not surprisingly, the Yankees’ final regular season record has been highly correlated to performance in the first quarter (r=.73 since 1901; r=.68 since 1961, when the 162 game season was initiated), so, if history holds, this year’s Bronx Bombers could be facing an uphill battle.

Yankees’ Historical Winning % (Full Season and After 44 Games) Correlation
 

Source: baseball-reference.com

Another somewhat ominous indication is the fact that only two Yankees’ teams who started the season as slowly as the current edition bounced back to win the division. What’s more, only six of the 46 first place finishes in franchise history started out with a winning percentage below .550. More often than not, when the Yankees’ have had a successful season, the team has gotten out of the gate quickly. This relationship is even stronger when only considering championships as nearly 60% of the franchise’s 40 A.L. pennants and 27 World Series victories came in seasons when the team’s winning percentage was at least .600 after 44 games.

Distribution of Yankees’ Postseason Teams Based on Record After 44 Games

Source: baseball-reference.com

Every season has its own set of mitigating factors that influence the final outcome. However, aggregate data can often smooth out some of the variables, providing a rough road map for what the future holds. As last year (which is probably the most relevant comparison, considering the proximity) proved, the Yankees are more than capable of shaking off early season doldrums, but that doesn’t mean fans, or the team itself, should minimize some of the struggles. If the Yankees do recover once again, they will need to perform much better across the board, and their ability to do so should not be taken for granted. In some arenas, slow and steady may work just fine, but in the pennant race, a fast start has always worked to the Yankees’ advantage.

Yanks Win by a Nose, but Offense Doesn’t Pass the Smell Test

Arod and Teixeira teamed up to record the final out of the game. (Photo: AP)

It wasn’t the resounding breakout game most Yankees’ fans have been desperately anticipating, but on the strength of three runs, and Alex Rodriguez’ game ending throw, the Bronx Bombers finally managed to squeak out a much needed victory.

May has mostly been a gloomy month for the Yankees, but one bright spot has been the baby steps taken by Phil Hughes. In tonight’s game, the right hander broke out of the gate strong, but then fell victim to two old bugaboos. In the top of the third, Hughes left an 0-2 pitch over the plate to Humberto Quintero, who promptly lined an RBI double into the right field corner. Entering the game, Hughes had allowed opposing hitters to bat an astounding .293/.341/.537 (or 191% better than the league average) when ahead in the count 0-2, so Quintero’s run scoring hit was only the latest in a season’s worth of frustration born of poor location.
The Royals added to their lead in the fourth inning when Jeff Francoeur drove a 2-0 fastball into the left field seats. The long ball has been a season-long tormenter of the Yankees’ starting rotation, but no one has been more vulnerable than Hughes, who has been victimized at least once in each of his starts.  In 47 1/3 innings, Hughes has now allowed 11 home runs, giving him the third highest rate per nine innings among all qualified major league starters.
The negatives aside, Hughes did manage to hold the Royals to only two runs over six innings, which was important because the offense wasn’t quite ready to bust out. The Yankees finally got on the board when Robinson Cano launched a long home run in the fourth inning, but the winning rally was much more subdued. In the bottom of the fifth, the Yankees loaded the bases on a seeing-eye grounder, hit by pitch, and bunt single, setting the stage for another golden scoring opportunity. With the memory of last night’s failure with bases loaded still fresh in everyone’s mind, Derek Jeter fell behind in the count, but finally produced a run with a single that was flared into right. Would this be the hit that would jump start the Yankees’ struggling offense and put an end to their futility with runners in scoring position? Unfortunately, the answer was no. After Curtis Granderson’s ground out produced another run, Alex Rodriguez and Raul Ibanez each went down swinging to end the rally.

Although the Yankees may not have exited the inning with good feelings, they did come away with the lead. Keeping it, however, wouldn’t be easy.  Over the final three innings, Joe Girardi used five different relievers to record the last nine outs (such is life without Mariano), but his master plan almost hit a snag in the bottom of the ninth inning. With two outs, Alex Gordon, who had doubled, was at third when Alcides Escobar hit a grounder that Rodriguez fielded deep behind the bag. Arod’s only play was to desperately put his entire body into the throw, which hurtled across the diamond as Escobar raced down the line. The ball finally nestled into Mark Teixeira’s outstretched glove just ahead of the base runner, giving the Yankees a victory by the narrowest of margins, and, perhaps, a one-day reprieve from having to answer questions about not getting the big hit.

Color By Numbers: To Homer, Or Not To Homer? Should That Be the Question?

Around this time last year, I took a look at the growing belief that the Yankees hit “too many home runs” and concluded there wasn’t much wisdom in that unconventional thought. However, following a recent period of offensive malaise, the same theme has popped up once again. So, let’s take another look.

Yankees’ Record in Homerless Games, Since 1918

Source: Baseball-reference.com

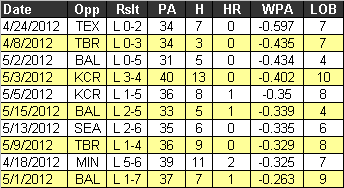
A fashionable statistic making the rounds this morning is the Yankees 0-8 record when the offense fails to hit a home run. Despite the very small sample, this still seems to be a very intriguing relationship, especially when you consider that in half of those games the Yankees only allowed four or fewer runs. What’s more, the team’s bottom-four and six of the bottom-10 games in terms of WPA (win probability added) also happen to come from among the eight they’ve played without hitting a home run. So, it seems as if the team’s offense has suffered from a feast or famine syndrome with the long ball. However, that doesn’t mean the problem is “too many home runs”.

Yankees’ 10 Lowest WPA Games, 2012

Source: Baseball-reference.com

So far this season, 91 of the Yankees’ 177 runs, or just over half, have come via the home run, which compares to 44% cumulatively between 1996 and 2011. Of course, it should also be noted that the Yankees’ current run/game average of 4.76 is almost three-quarters off the .5.48 rate posted from 1996 to 2011. In other words, the Yankees aren’t hitting too many home runs. They just aren’t scoring enough runs, which is mostly a byproduct of a recent dry spell with runners in scoring position (it wasn’t too long ago that the team was scoring at a historic pace).

Just as the Yankees have found it difficult to win when they don’t hit a home run, the team has had good success when its pitchers keep the ball in the ballpark. Unfortunately, there have only been seven such occasions, which is by far the lowest percentage of homerless games since at least 1918. With the exception of C.C. Sabathia, Yankees’ starters have given up more than their fair share of homers, which, in turn, has significantly mitigated the relative power advantage that the team usually enjoys. This is the real problem.

Percentage of Games in Which Yankees Have Not Allowed a Home Run, Since 1918

Source: Baseball-reference.com

It’s easy to understand why so many Yankees’ fans harp upon the team’s offense. Historically, the Bronx Bombers have been a team defined by the strength of its bats, so when the lineup underperforms those high expectations, it becomes easy to point the finger at the offense. Having said that, just because the offense hasn’t been a weakness doesn’t mean there isn’t reason for concern. Although the Yankees’ offense is still very strong when compared to the rest of the league, it might not be good enough to overcome the team’s underperforming rotation. That’s why the Yankees biggest concern shouldn’t be the number of home runs hit by its lineup, but instead the amount allowed by its starters.

Color By Numbers: Who Needs a Hit?

A walk is as good as a hit. Even though some traditionalists might view such a statement as sabermetric hokum, that sentiment has been expressed by coaches from little league to the majors for who knows how many years. Of course, that doesn’t necessarily make it true. In many cases, a hit is much more valuable than a base on balls, but in terms of preserving precious outs, both are equally effective.

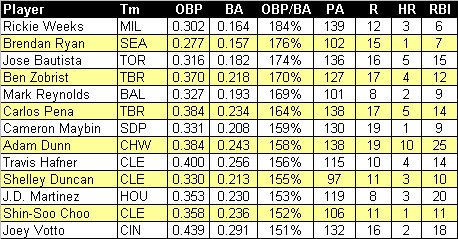
With the Rays in town, it’s the perfect time to examine the relationship between batting average and on-base percentage. Over the first two games of the current series at Yankee Stadium, the first two hitters in the Tampa lineup have been Ben Zobrist and Carlos Pena, whose relatively low batting averages make them seem like an unlikely pair to feature in the first two slots. Leave it to Joe Maddon to think outside the box, but, in this instance, his strategy isn’t very unorthodox.  You see, Zobrist and Pena have two of the highest on-base percentages on the team.

Having a high on-base percentage despite a low batting average isn’t very common, but in Zobrist and Pena, the Rays have two of the top three hitters in terms of the differential between both rates (Zobrist is first at .152 and Pena is third at .150; Dodgers’ AJ Ellis is second at .151).  Both hitters also rank among only 13 qualified batters who currently have an on-base percentage at least 150% greater than their batting average, so teams facing the Rays might be lulled into a false sense of security if they only focus on the latter.

Hitters with OBP to BA Ratios of At Least 150%, Qualified Batters in 2012

Source: Baseball-reference.com

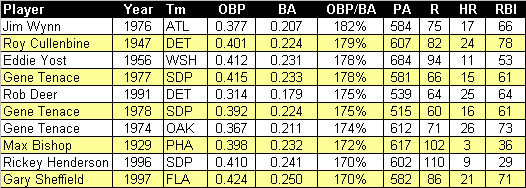
With an on-base percentage that is 184% of his batting average, Brewers’ second baseman Rickie Weeks has managed to salvage some value from the disappointingly slow start to his 2012 season. Like most of the members of the list above, his high ratio is mostly the result of having a subpar batting average. However, there is one standout. Reds’ All Star first baseman Joey Votto has piggybacked on a very respectable batting average of .291 with an on-base percentage that ranks fifth in the National League, which is par for the course for the former MVP, whose career ratio is 130% (.406 OBP vs. 312 BA).

If Weeks maintains his current rates, he’d break the current on-base versus batting average differential record of 182% (based on qualified seasons), which was set by Braves’ outfielder Jimmy Wynn in 1976. That season, the Toy Cannon only hit .207, but, thanks to a league leading 127 walks, still finished in the top-10 in on-base percentage. In total, 175 players have had a qualified season with an OBP/BA ratio of at least 150%, but none has been more impressive than Barry Bonds’ 2004 campaign. That season, the homerun champion won the batting title with a .362 average and still managed to post a high multiple by reaching base in a remarkable 61% of all plate appearances.

10 Highest OBP to BA Ratios, Qualified Seasons since 1901

Source: Baseball-reference.com

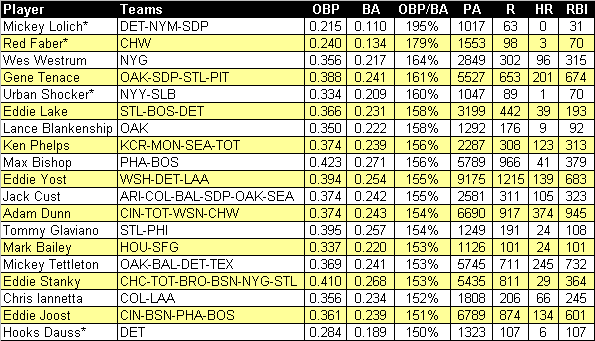
It’s hard enough for a hitter to reach base at a high multiple to his batting average in a single season, much less for an entire career. However, 19 players with at least 1,000 plate appearances have managed to turn the trick, and chief among them was Mickey Lolich. In his 16 major league seasons, which spanned the advent of the DH rule, the former Tigers, Mets, and Padres pitcher ended his batting career with more walks than base hits (105 to 90). As a result, Lolich’s on-base percentage was nearly double his batting average, a discrepancy that easily ranks as the widest in baseball history.

Hitters with Career OBP to BA Ratios of At Least 150%, 1901

*Indicates pitchers.
Note: Based on a minimum of 1,000 plate appearances.
Source: Baseball-reference.com

Among position players, West Westrum’s 164% multiple ranks as the largest differential, but the most impressive divergence probably belongs to Gene Tenace, whose on-base percentage was 161% higher than his batting average in over 5,500 plate appearances. Tenace, a catcher/first baseman whom some regard as a borderline Hall of Famer, ended his career with a very impressive OPS+ of 136, making him a prime example of a hitter capable of providing significant value over and beyond his relatively low batting average.

What about the other end of the spectrum? For a look at those hitters whose ability to reach base rests solely on their bats, join me for a companion piece over at the Captain’s Blog.

Color By Numbers: Better to Be Lucky? Or, the Curious Case of Ivan Nova

Photo: Getty Images

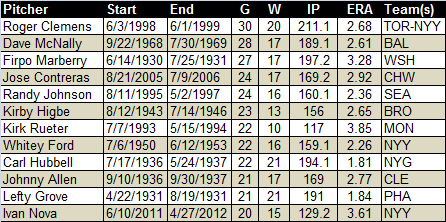
Ivan Nova’s luck finally ran out. For the first time since June 3, 2011, the Yankees’ right hander was tagged with a loss, snapping a streak of 15 straight victories, which ranks as the 17th longest stretch since 1918.  Because of the outcome, Nova’s streak of 20 games without a loss also game to an end, leaving him two behind Whitey Ford for the franchise record (Roger Clemens’ stretch of 30 games with the Blue Jays and Yankees from 1998 to 1999 is the all-time record).

Longest Streaks Without a Loss by a Starter, Since 1918

Note: 12 other pitchers are tied with Nova at 20.
Source: Baseball-reference.com

In fairness to Nova, his streak wasn’t all about luck. During the 20 games in which he went without a loss, the righty posted a respectable ERA of 3.61 to go along with an average Game Score of 53.7. However, those figures usually don’t add up to such a long winning streak. Of course, that’s because one very important statistic has been left out of the equation. During Nova’s streak, the Yankees offense scored 139 runs, or nearly seven per game. As a result, Nova was able to avoid being saddled with a loss in nine games in which his Game Score was below 50, including two that were below 25.

Just like his winning streak, Ivan Nova’s early career has been a contradiction. In his first 23 starts, the right hander posted an impressive 9-4 record, but it was supported by very questionable peripherals. However, after returning from a mid-season demotion, Nova was a very different pitcher. Thanks to an increased use of his slider, the 24 year-old bolstered his Rookie of the Year credentials by not only going 8-0, but doing so with much more impressive underlying statistics.

Over the first five games of 2012, Nova’s development has seemingly taken two different tracks. On the one hand, he has continued to improve his strikeout and walk rates, which should bode well for overall performance. However, those trends have come at a price because the right hander has also experienced a very significant spike in the number of hits and home runs allowed. To this point, the negatives have outweighed the positives, at least based upon Nova’s ERA and average Game Score.

A Tale of Three Pitchers: A Segmented Look at Nova’s Career

Source: Baseball-reference.com

So, what are we to make of Nova? On the one hand, his improved ability to generate strikeouts and avoid issuing free passes seems very promising. Considering his astoundingly high BABIP (batting average on balls in play) of .398, it also seems as if Nova has been the victim of bad luck (and perhaps bad defense). At least that’s what measures like xFIP suggest. According to that metric, which takes into account peripherals as well as a normalized HR rate to predict a pitcher’s future performance, Nova’s inflated ERA of 5.58 should be more like 3.83. The Yankees would probably sign up for that without a second thought.

But, can we just dismiss all of the hits and homers that Nova has surrendered? Although his BABIP is abnormally high, it’s worth noting that the number of line drives and fly balls hit off Nova have increased (from 47.3% combined in 2011 to 55.8% in 2012), which might explain why he has allowed so many more extra base hits. However, that doesn’t explain why he has transformed from a groundball pitcher to one who allows so many batted balls to be hit in the air.  One possible answer could be that Nova is throwing too many strikes, particularly early in the count. Although that theory is supported by the high OPS against Nova in first pitch, 0-1, 1-0, and 1-1 counts, a sample of only five starts makes it far from conclusive.

Ivan Nova’s Performance in Various Counts, 2012

Note: sOPS+ compares a split to the adjusted average for the league. A reading above 100 for a pitcher is considered below average.
Source: Baseball-reference.com

Who is the real Ivan Nova and what role has luck played in his early career? His success has seemed to be a byproduct of good fortune, while his struggles appear rooted in bad luck, making it impossible to get a good handle on exactly what kind of pitcher he has been, not to mention will be. So, despite his impressive winning percentage, Nova remains one of the many question marks in the Yankees’ rotation, which, this year, hasn’t been lucky or good. At this point, I’ll settle for either.

No Relief in the Rotation as Yanks Fall Again in Texas

An early hook has become a regular part of Phil Hughes' starts (Source: AP).

You can never have enough starting pitching. During the offseason, that was Brian Cashman’s mantra as he built a rotation that went seven men deep. Tonight, it was a lesson the Yankees learned the hard way.

After announcing that Michael Pineda would miss the rest of the season with a torn labrum, the Yankees were looking for Phil Hughes to put his stamp on the rotation. However, those hopes were quickly dashed as the enigmatic right hander couldn’t even pitch his way through the third inning. Even more disconcerting than the four runs he allowed in his brief appearance was the continued lack of command that has dogged him since the second half of 2010. On several occasions, Hughes missed Russell Martin’s target by a wide margin, and almost without fail, the Rangers made him pay.

The Yankees scratched their way back into the game with two runs in the top of the fourth inning, but David Phelps, who may have been auditioning for a role in the rotation, didn’t provide much relief. In 2 1/3 innings, the young right hander allowed three runs, including two long balls, which effectively put the game out of reach. In the process, Phelps’ hiccup probably also quieted any outcry to have him take Hughes spot in the rotation.

With Hughes continuing to struggle and Pineda on the shelf, Andy Pettitte’s outing in Trenton took on even greater importance. In five-plus innings covering 81 pitches, the veteran lefty allowed seven hits and four runs, but was still pleased with his outing. However, he did admit that he wasn’t quite ready to return to the big leagues, which means the Yankees will have to hold their breath with Hughes and Freddy Garcia for at least a few more weeks.

Over the first 18 games, the Yankees have only recorded five quality starts, which, over a similar span, is the second lowest total in franchise history.  It probably wasn’t what he had in mind at the time, but, so far at least, Brian Cashman’s pre-season assessment appears to be right on the money. The Yankees most certainly do not have enough starting pitching.

[Featured Image via The Tropical Variation]

Color By Numbers: Back It Up

Backup catcher can be a thankless job. Off all the bench positions, the second string backstop is arguably the most scrutinized and most criticized, particularly because so many people tend to overlook defense and hone in on their typically meager offensive contributions.

Most Games by a Yankees’ Catcher, Since 1918

Note: Includes games in which the player PH for the existing catcher.
Source: Baseball-reference.com

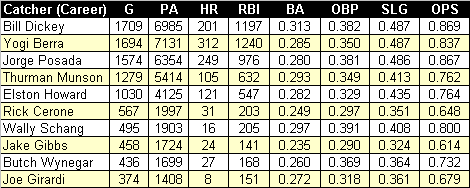
Over the years, the Yankees have been blessed with several elite catchers. From Bill Dickey to Yogi Berra, Elston Howard, Thurman Munson, and Jorge Posada, the Bronx Bombers have often enjoyed a comparative advantage behind the plate. Combined, that quintet has played 44% of the team’s “catcher games” (based on total games played at catcher, not in each season) and accounted for around 50% of most statistical contributions from the position. However, these all-time greats have had some help along the way.

The Best vs. the Rest: Comparison of Yankees’ Catchers, Since 1918

Note: Includes games in which the player PH for the existing catcher.
Source: Baseball-reference.com

In addition to the All Stars mentioned above, the Yankees have had 114 catchers since 1918, ranging from Billy Shantz, who appeared in only one game but never had an at bat, to Rick Cerone, who played 567 games as a catcher and finished seventh in the 1980 MVP balloting.  This less than stellar group of backstops has compiled a batting line of .254/.326/.367, which, while paling in comparison to the rates posted by the team’s better catchers, still seems respectable (for context, major league catchers hit a combined .245/.313/.389 in 2011). However, those totals include the contributions of several starters, and today, we’re only concerned with the backups.

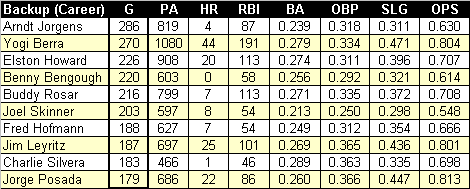
Most Games as a Yankees’ Backup Catcher, Since 1918

Note: Includes games in which the player PH for the existing catcher. Backup role defined as any catcher but the one with the most games behind the plate in an individual season.
Source: Baseball-reference.com

Norwegian-born Arndt Jorgens ranks as the most prolific backup catcher in Yankees’ history. From 1929 to 1939, Jorgens served as a second stringer to Bill Dickey, joining the likes of Benny Bengough, Buddy Rosar (both of whom also rank among the top five) and Joe Glenn in that role. Interestingly, Dickey’s Hall of Fame successor, Yogi Berra, also ranks as the second most tenured backup. Berra was a second stinger, at least in terms of catching, both at the beginning of his career and the end, when he moved to the outfield to make room for Elston Howard. Turnabout was fair play for Howard, who spent the first five years of his career alternating between the outfield and Berra’s primary backup.

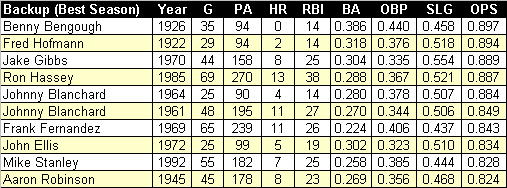
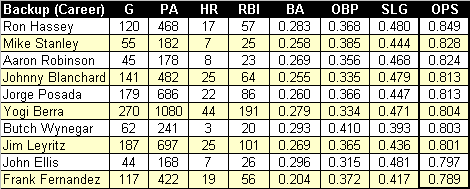
Top-10 Career OPS by a Yankees’ Backup Catcher, Since 1918

Note: Includes games in which the player PH for the existing catcher. Backup role defined as any catcher but the one with the most games behind the plate in an individual season. Totals above exclude years in which the player led the team in games behind the plate. Minimum of 150 career plate appearances.
Source: Baseball-reference.com

Older Yankees’ fans probably remember Ron Hassey very well. In 1985 and 1986, the plodding catcher posted a prolific OPS of .846, while serving as Butch Wynegar’s primary backup. In the process, he also earned the nickname “Babe” because his lefty swing and titanic homeruns resembled the Bambino. In the 1990s, Mike Stanley was a similar-styled player. Before ascending to the starting job in 1993, his bat made him a fan favorite when he was Matt Nokes’ backup in 1992. After becoming the lead man, Stanley turned the role over to Jim Leyritz, who provided steady offense behind the plate in nine seasons as a second stringer for the Yankees. However, Leyritz greatest notoriety came in the postseason, during which he authored two of the most dramatic home runs in franchise history.

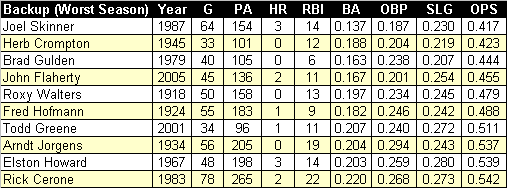
10 Best/Worst OPS Seasons by a Yankees’ Backup Catchers, Since 1918

Note: Includes games in which the player PH for the existing catcher. Backup role defined as any catcher but the one with the most games behind the plate in an individual season. Minimum of 75 plate appearances and seasons by Yogi Berra and Jorge Posada excluded.
Source: Baseball-reference.com

Considering the relatively limited playing time of a backup catcher, their offensive performance is difficult to predict. For every Benny Bengough who surprises with an exemplary season, there’s a Joel Skinner who consistently makes fans groan every time they see his name penciled into the lineup. Although the Yankees have recently had some success getting offense from their backup catcher, Jose Molina (2007) and John Flaherty (2003-2004), for the most part, the team’s second stringers have been light with the bat. Luckily, there is organization depth at catcher because as frustrating as it is to have a backup who can’t it, it’s much worse when the same is true about the starter.

Yankees Use Backup Plan to Even Series Against Twins

Photo: AP

Backup catchers should be seen, but not noticed. During the YES broadcast, that’s how former Yankees’ second stringer John Flaherty described the life of a number two backstop. Chris Stewart must not have gotten the memo.

Over the first 10 games of the season, the Yankees have had no problem getting men on base, but driving them in hasn’t been as easy. So, after squandered scoring opportunities in the first two innings by leaving a total of five men on base, it seemed as if it would be another frustrating night in the Bronx. However, all that changed in the bottom of the third.

After falling behind 3-1 in the top half of the inning (which also featured the ejection of Twins center fielder Denard Span and manager Ron Gardenhire), the Yankees quickly mounted another rally, but this time they would not be turned away. The unlikely hero in the inning was Stewart, who, in only his fifth at bat of the season, gave the Yankees a 4-3 lead with a bases loaded single that knocked Twins’ starter Francisco Liriano from the game. In total, the team scored four runs in the inning and then never looked back.

Once staked to a lead, CC Sabathia took his game to another level. In each of the next three innings, the big lefty retired the Twins in order and at one point set down 13 consecutive Minnesota batters. Meanwhile, the Yankees continued to tack on runs, including two more RBIs from Derek Jeter, a homerun by Andruw Jones, and a final tally by Stewart, who ended the game with a career-high 3 RBIs. The outburst was more than enough for Sabathia, who departed with one in the eighth having given the Yankees only their third quality start of the season.

Although Stewart was the focal point of the offense, just about every hitter had a good night. However, there was one exception. Alex Rodriguez was not only the sole member of the lineup without a base hit, but his failure to drive in a run extended a peculiar streak that has seen the Bronx Bombers go 11 straight games without an RBI from the cleanup slot, the fifth longest such stretch in baseball history. For most teams, such a prolonged period of futility from the cleanup slot would debilitating, but the Yankees’ have managed to win six of their first 11 games without a contribution from the four-hole. Of course, that really shouldn’t be surprising. What else would you expect from a lineup that has a backup catcher capable of driving in three runs in one game?

Color By Numbers: Generation Gap

Thanks to some sloppy defense by his Rockies’ teammates, Jamie Moyer was thwarted in his recent attempt to surpass Jack Quinn as the oldest pitcher to win a major league game. However, the 49-year old Moyer and his 22-year old opponent Madison Bumgarner did manage to make an imprint on history. The 26 years and 256 days between the birthdays of the grizzled veteran and fresh faced youngster represented the largest age differential for opposing starters in almost 47 years.

Greatest Age Differential Between Opposing Starters, Since 1918

Source: Baseball-reference.com

When the 59-year old Satchel Paige faced 29-year old Bill Monbouquette at the end of 1965 season, it was the culmination of a publicity stunt by Kansas Athletics’ owner Charles O. Finley. Of course, that didn’t stop Paige from throwing three shutout innings. Twelve years earlier, Paige was also involved in the second largest age differential for starters when he faced 18-year old Bob Miller in 1953. Had he not inexplicably been excluded from the majors during the interim, Paige’s name would likely be all over the list above. Instead, it’s Phil Niekro who dominates, but maybe not for long. If Moyer has a rematch with Bumgarner, or faces pitchers like Randall Delgado, Blake Beaven, Rick Porcello, Stephen Strasburg, Neftali Feliz, Clayton Kershaw, Trevor Cahill, Mike Minor, or Mat Latos, he’ll gradually take Niekro’s place.

Greatest Combined Age of Opposing Starters, Since 1918

Source: Baseball-reference.com

Moyer has also contributed to three of the seven games since 1918 that have featured a combined starters’ age of at least 87 years. Although the Rockies’ lefty should have a few chances to add to the list, his prospects for topping the record of 90 years and 135 days, which is held by Don Sutton and Phil Niekro, seem slim. The Mets’ Miguel Batista (41 years and 53 days on April 12, 2012) is the only active opponent who could combine with Moyer to surpass the high water mark, but he is currently relegated to bullpen. So, unless he happens to get a spot start against Moyer, or another veteran makes a comeback at just the right time, the ageless lefty will probably have to wait until next year to break Sutton and Niekro’s record.

Percentage of Pitchers 40 or Older and 20 and Younger, Since 1918

Source: Baseball-reference.com

With the exception of a spike in older starters during the middle of the last decade, the percentages of pitchers 40 and older or 20 and younger have been trending down.  So, if Moyer isn’t able to find someone to help him break the records set by Paige/Monbouquette and Niekro/Sutton, they just might last forever. Unless, of course, Moyer lasts forever himself, which might not be out of the question.

Color By Numbers: Opening Time

Photo: Peter Adams Photography

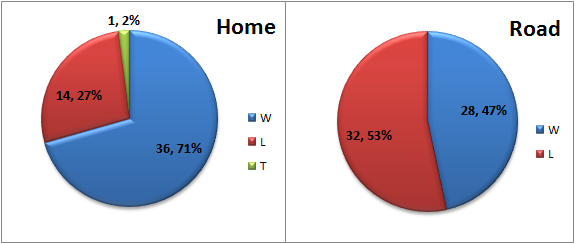
The Yankees open up their 112th season against the division rival Tampa Rays. Although the two teams previously faced off on Opening Day in 2004, those games were played in the Tokyo Dome, so this afternoon’s contests marks the first time the Yankees will begin a season at Tropicana Field. Entering the game, the Yankees are 64-46-1 (.577) on the season’s first day, but when opening up on the road, the team is below .500 and has lost seven of the last 10.

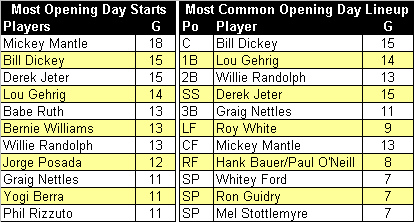
On an individual note, C.C. Sabathia is making his fourth consecutive Opening Day start, the most since Mel Stottlemyre did the same from 1967 to 1970 (the record is six, which was accomplished by Lefty Gomez from 1932 to 1937). With his 16th Opening Day start, Derek Jeter moves past Bill Dickey for sole possession of second place on the Yankees’ all-time list. If the Captain starts the opener in each of the final two years left on his current deal, he’d tie Mickey Mantle for the franchise lead. However, Jeter’s run of starts is not consecutive because a strained thigh muscle kept him out of the 2001 opening game.

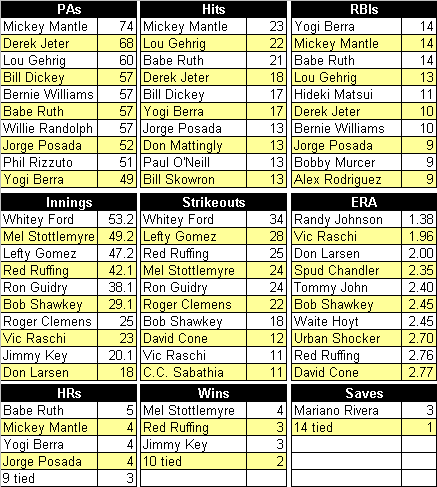
Listed below is an assortment of team and player Opening Day facts and figures to keep you busy until the start of this afternoon’s game.

Yankees Opening Day Record, 1901-2011

Source: Baseball-reference.com

Yankees Opening Day Starters, 1918-2011

Source: Baseball-reference.com

Select Individual Player Opening Day Records, 1918-2011

Note: ERA based on a minimum 10 innings pitched.
Source: Baseball-reference.com

Yankees Top Offensive Performers on Opening Day, 1918-2011

Note: Ranked by OPS; minimum 20 plate appearances.
Source: Baseball-reference.com

Yankees Top Pitching Performances on Opening Day, 1918-2011

Note: Ranked by Game Score.
Source: Baseball-reference.com

Color By Numbers: Untapped Power

At the beginning of March, Dodgers’ first baseman James Loney talked confidently about being a legitimate candidate for the batting title in 2012. Considering how many people view him as a disappointment, not to mention he has never even hit over .300 in a qualified season, Loney’s optimism was intriguing to say the least. So, last week, I took a look at other batting champions who had never hit .300 before their 28th birthday and, not surprising, discovered very few.

Before writing about Loney’s pursuit of a batting crown, I hadn’t given the first baseman much thought. However, while listening to Vin Scully broadcast a recent Dodgers’ spring training game, the left handed hitter was thrust to the forefront once again. During the game, Scully relayed a story about adjustments Loney had made that the lefty believed would allow him to hit for more power…even as many as 30 home runs this season. Once again, for a player who had never hit more than 15, Loney seemed guilty of wishful thinking.

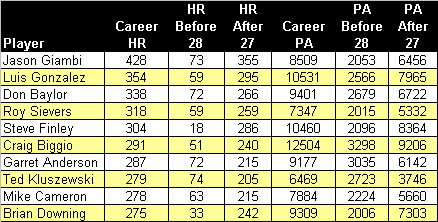
Career Home Run Leaders Among Late Bloomers*

 *Includes players with at least 2,000 PAs before their age-28 season who hit 75 or fewer homers.
Source: baseball-reference.com

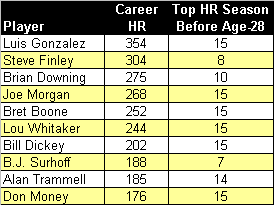
Since 1901, 685 players (including Loney) with at least 2,000 plate appearances hit 75 or fewer home runs before their age-28 season.  From this group, only 31 went on to hit more than 200 home runs in their entire career. Going one step further, only seven batters from this segment hit more than 200 long balls without having recorded more than 15 homers in a season during this timeframe. In other words, if Loney does turn on the power, it will qualify as a historical achievement.

Career Home Run Leaders Among Even Later Bloomers*

*Includes players with at least 2,000 PAs before their age-28 season who hit 75 or fewer homers and never more than 15 in any one season.
Source: baseball-reference.com

To be fair, Loney only implied that he could hit 30 home runs in a season. However, even this accomplishment would go against the tide of history because only 27 players (in 50 seasons) from the group of 685 defined above wound up having their first 30 home run season after turning 28. What’s more, most of those hitters gradually worked their up to 30 home runs, whereas Loney would have to double his output in order to reach that level in 2012.

Late Bloomers* Who Had First 30 Home Run Season at Age-28

*Players with at least 2,000 PAs and no more than 75 homers before their age-28 season.
Source: baseball-reference.com

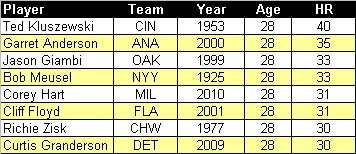
The list above includes three players who offer Loney some immediate hope. For most of his Yankees’ career, Bob Meusel was a productive, but often overlooked member of Murders’ Row. That’s what happens when you play alongside Lou Gehrig and Babe Ruth. By their standards, Meusel wasn’t really a power hitter, but in reality, his more modest totals were still good enough to rank among the league leaders. In 1925, when Gehrig was just breaking in and Babe Ruth was suffering from “the bellyache heard around the round”, Meusel finally was the top dog. That season, the left fielder belted 33 homers to lead the league. It would be the highest total of his career and only his second season with more than 16.

With bulging biceps exposed by his trademark sleeveless uniform, Ted Kluszewski became synonymous with power. And yet, Big Klu was a late convert to the long ball. In 2,723 plate appearances before turning 28, the muscular first baseman only had 74 home runs, or only seven more than Loney. Over the next four years, however, he hit 171, including 40 or more in three consecutive seasons. During that span, no one hit more home runs than Kluszewski, but thanks in large part to several nagging injuries, the slugger’s power quickly dissipated as he combined to hit only 34 home runs in his last five seasons.

Garrett Anderson vs. James Loney, Pre Age-28 Seasons

Source: baseball-reference.com

Before turning 28, Garrett Anderson’s statistics were very similar to Loney’s. So, if the pattern holds, the Dodgers’ first baseman just might be in line for a breakout power season. In 2000, Anderson, who had only once hit more than 16 homers (21 in 1999), belted 35 long balls, beginning a four-year stretch in which he flirted with that plateau in each season. Considering the similarities, maybe the Dodgers can just go ahead and pencil in more power from first base?

If Los Angeles has a little patience, the real poster boy for late power is Steve Finley. Before entering his age-31 season, the left handed centerfielder had only 47 home runs in nearly 4,000 plate appearances. Then, all of a sudden, he flipped the switch. Not only did Finley belt 30 long balls as a 31-year old in 1996, but he maintained his power over the remainder of his career.

At the rate he is going, James Loney will enter the season convinced he can win the triple crown. Has he made a believer out of you? I am still skeptical, but for the first time, I’ll be keeping a close eye on Loney’s pursuit of history.

Oh, by the way, did I mention this is Loney’s contract year? Ironically, if the Dodgers first baseman does have the breakout season he is predicting, it could mean the end of his days in Los Angeles, especially with teammate Andre Ethier also headed for free agency. Almost 10 years ago, the Dodgers faced a similar situation when Adrian Beltre parlayed a career season into a big free agent contract with another team. The Dodgers were wise to let Beltre go back then, but this time around, a big season from Loney might compel the new ownership group to keep him. In that respect, a lot more than just history is riding on Loney’s 2012 season…millions of dollars are at stake as well.

Color By Numbers: Kryptonite and Spinach

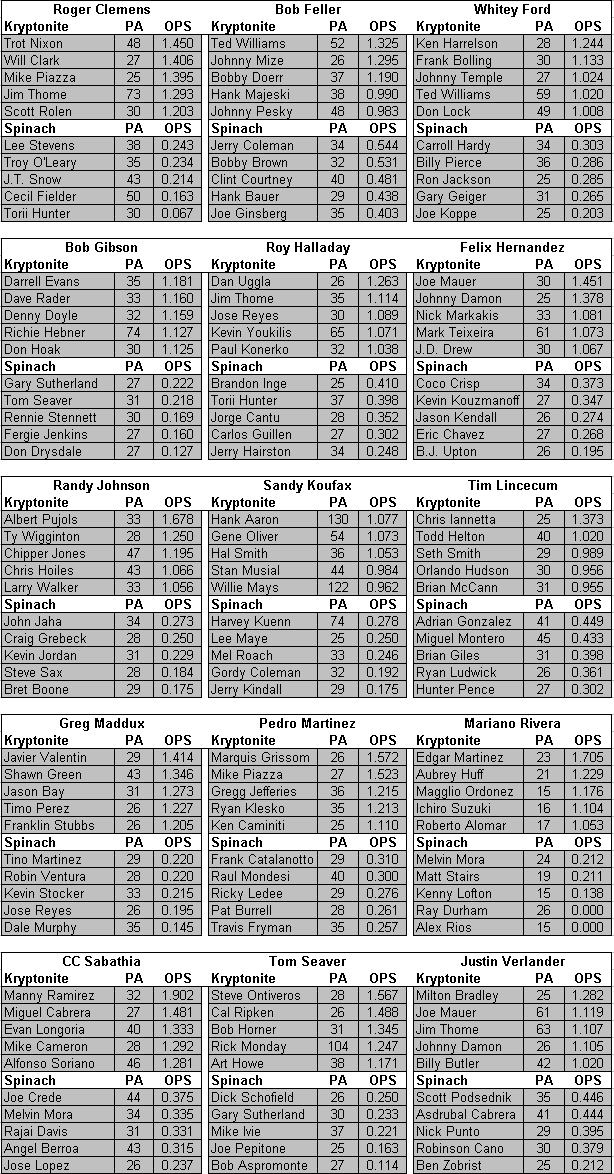
Superman had his kryptonite. Mariano Rivera had Edgar Martinez.  In 23 plate appearances against the immortal closer, the Mariners’ prolific DH batted an incredible .579/.652/1.053. When there’s a clash of the titans, someone has to win, and in this rare instance, the great Rivera was usually on the wrong side of the battle.

If Martinez was Rivera’s kryptonite, Ray Durham was his spinach. In 26 plate appearances against the closer, the former All Star 2B never got a hit. Although extreme in his level of futility, Durham has plenty of company among hitters who have been dominated by Rivera. Over 40% of the 83 players with at least 15 plate appearances against the all-time saves leader have posted an OPS below .600, so, just like a real life superhero, the Yankees closer is accustomed to getting his man.

Kryptonite and Spinach for a Selection of Top Pitchers
 
Note: Based on hitters with a minimum of 25 plate appearances (15 PAs for Rivera) against each starter. Includes post season results.
Source: Baseball-reference.com

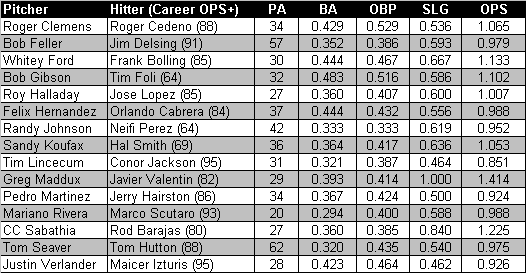
The chart above lists the five hitters with the most and least success (i.e., the kryptonite and spinach) against Rivera as well as a selection of top starting pitchers from both the present and past. As you can see, the chief nemeses for an elite pitcher are often hitters of equal renown. For example, Bob Feller had Ted Williams, Randy Johnson had Albert Pujols, and Sandy Koufax was made human when facing the immortal trio of Hank Aaron, Stan Musial and Willie Mays. However, there are some anomalies, such as Steve Ontiveros’ success against Tom Seaver. In 28 plate appearances, the former corner infielder for the Giants and Cubs, who had a career OPS of .731, managed to more than double that rate when facing Tom Terrific. The same relationship also existed between Greg Maddux and Javier Valentin, a light hitting catcher who somehow managed to solve the riddle of the Braves’ right hander.

The Seaver/Ontiveros and Madduz/Valentin pairings are probably the most surprising from the chart above, but that doesn’t mean the other elite pitchers haven’t had their share of unlikely antagonists. Marco Scutaro has been one of Rivera’s more frequent tormenters, while teammate CC Sabathia has found Rod Barajas to be one of his toughest outs. Two light hitting infielders, Jose Lopez and David Eckstein, have given Roy Hallday headaches, while Jerry Hairston Jr. is on a very small list of hitters who had Pedro Martinez’ number. Very few pitchers have been more intimidating than Bob Gibson, but that didn’t stop one of the worst hitters in baseball history from dominating the right hander. No hitter with at least 4,750 plate appearances has an OPS+ lower than Tim Foli’s 64, yet, somehow the journeyman managed to bat .483/.516/.586 against Gibson. Not to be outdone, Neifi Pérez, who matched Foli’s infamy by posting an OPS+ of 64 in over 5,500 plate appearances, also picked on one of the game’s greatest pitchers. In 42 plate appearances against Randy Johnson, Pérez raised his game exponentially, batting .333/.333/.619 against the Big Unit.

Unlikely Antagonists

Note: Hitters selected based on a combination of plate appearances and OPS+. Includes post season results.
Source: Baseball-reference.com

The chart below displays the distribution of OPS rates compiled by batters with a minimum number of plate appearances against our selection of great pitchers (see note for explanation of criteria used).  Rivera and Clemens are the only two pitchers from the group to keep a hitter under an OPS of .100, while Clemens also scored the lowest percentage of hitters who racked up an OPS over 1.000. Among the starters, only Pedro matched Rivera in terms of the number of hitters with an OPS against below .700; Tim Lincecum is the leader of the actives. Finally, all but Feller, Sabathia, and Hernandez have more “blue” than “red” on their charts, but it should be noted that trio pitched more seasons in a higher run environment than all others but Rivera and Halladay.

“OPS Against” Distribution for Select Group of Top Starters

Note: Based on hitters with a minimum of 25 plate appearances (15 PAs for Rivera) against each starter. Also, a 7% OPS adjustment (based on a crude comparison of league OPS in the different eras) was used to approximate the lower run environment that existed during the careers of Seaver, Ford, Gibson, and Koufax. Includes post season results.
Source: Baseball-reference.com

Color By Numbers: International Pastime

Baseball used to be just the National Pastime, but now, America’s greatest game belongs to the world. Official Opening Day rosters haven’t been decided upon yet, but there’s a good chance the percentage of players born outside the United States could top 30% for the first time in history, further cementing baseball as the most diverse of the three major American sports (if Canadian and U.S. players are considered “domestic”, baseball’s international participation is  also greater than the NHL’s).

Comparison of International Participation Among Major Sports


Note: For NHL, domestic includes the U.S. and Canada.
Source: baseball-reference.com (2011); profootball-reference.com (2011-12); NHL.com (2010-11); rpiratings.com (NBA: 2011-12)

For much of its first 100 years, baseball was mostly composed of American born players. However, when Jackie Robinson broke the color barrier in 1947, that started to change. Soon after Robinson’s debut, an increasing number of international players, particularly those hailing from Cuba, Mexico, and Puerto Rico, began filtering into the league. As a result, the percentage of foreign born players increased from 3.6% in 1947 to 9.0% in 1961, the first year of expansion.

Domestic vs. International Participation in MLB, 1901 to 2011


Note: Data is not continuous, but based on five-year segments.
Source: Baseball-reference.com

With more teams came the need for a deeper talent pool, so over the next decade, international participation continued to trend up, reaching 12.5% by 1976, even though the number of Cuban born players was significantly curtailed by Fidel Castro’s revolution. Filling the void left by the absence of Cuban players was an influx of talent from Venezuela and the Dominican Republic as well as even greater participation from Mexico and Puerto Rico.

For the next 10 years, the number of international players remained stagnant. Perhaps not coincidentally, that was also the first decade of free agency. With a ready of supply of proven major league talent now regularly available, perhaps teams became less inclined to spend on international scouting? Whatever the reason, the number of foreign born players began to increase again in the mid-1980s, right around the time free agent salaries began to skyrocket. Since that point, the trend toward greater diversity has continued unabated.

Percentage of International Players, By Country


Note: Data is not continuous, but based on five-year segments. Percentages are based on international segment only.
Source: Baseball-reference.com

In 2010, the international presence in the major leagues peaked at 28.2% (the all-time high based on Opening Day rosters was 29.2% in 2005). Considering the increasing number of high profile international free agent signings and gradual development of foreign born prospects, both of those rates could be eclipsed in 2012, but for how much longer will the trend continue?

One of the key components of baseball’s new CBA is a provision that effectively creates a salary cap for amateur international free agent signings. Although not as extreme as folding foreign born amateurs into the Rule IV draft, this new system could have similar effects. In particular, there has been concern expressed about whether budgetary restrictions placed on international signings will discourage teams from investing overseas (i.e., why fund an academy if the ability to sign the prospects is limited?). Worth noting in relation to this concern is that since Puerto Rican players were added to the draft in 1990, the number of major leaguers hailing from the island has declined from 3.4% of all players and 24.3% of international players to 2.2% and 8%, respectively, in 2011. Needless to say, if a similar effect results from the new CBA, the percentage of foreign born players in the majors could reverse course.

Not only has there been a significant increase in the number of international players, but baseball has also experienced demographic shifts within the domestic population. For the first 30 years of the modern major leagues, the Rust Belt contributed the highest percentage of players, with Pennsylvania, Ohio, Illinois, and New York leading the way. By the 1930s, however, warmer weather states like California and Texas, which not coincidentally hosted some of the best minor leagues circuits in the country, began to take over.

Domestic Participation in MLB, 1901-2011


Note: Data is not continuous, but based on five-year segments.
Source: Baseball-reference.com

Baseball’s state demographics remained relatively stable from the 1930s to the 1960s, at which point the number of players hailing from California and abroad began to take its toll on the rest of the country. More recently, however, the Golden State’s share of the player population has started to abate, dropping from nearly 25% in the mid-1980s to the current rate of 16.1%. This decline allowed the number of foreign born players to surpass the individual rates of every state for the first time in 1996.

Over the past five years, there has been an uptick in the percentage of players born in Texas and Florida, which seems like a trend that will continue. On the other hand, every other state now falls below the 3% level, meaning nearly one in two American born players is a native son of California, Texas, or Florida. Of course, it should be noted that those states have three of the four highest populations, but even on a per capita basis, they rank among the leaders.

Per Capita Domestic Participation in MLB, Top- and Bottom-10, 2011


Source: Baseball-reference.com and 2010 U.S. Census data

Despite the increased concentration among domestic players, baseball’s international presence has fueled its unprecedented diversity. This melting pot has been a recipe for success, not only on the field, but in the board room as well. So, the next time someone tries to argue that baseball is no longer the National Pastime, just smile and nod your head. They’re right. Baseball is now the International Pastime.

Color By Numbers: Will Youth Serve the Yankees?

Now that A.J Burnett has been forced to walk the plank, the 2012 Yankees’ starting rotation has begun to take its final shape. Although Joe Girardi has promised a battle between the veteran Freddy Garcia and one-time top prospect Phil Hughes for the fifth slot, the young right hander seems to have the inside track. Then again, Hughes isn’t really that young any more, at least not by the standards of the Yankees’ 2012 rotation.

If Phil Hughes breaks camp as the fifth starter, he’ll no longer be the baby of the staff. Along with Ivan Nova (25) and Michael Pineda (23), Hughes would give the Yankees three starters no older than 26, providing a youthful complement to the 31-year old CC Sabathia and 37-year old Hiroki Kuroda. At an average age of 28.4, the 2012 rotation would represent the team’s youngest starting staff since 1995 and fourth youngest in the last 30 seasons.

Average Age* of New York Yankees’ Starters, 1901-2011

*A weighted average based on the number of innings pitched as a starter only.
Note: Red data points indicate years the Yankees won the World Series.
Source: Baseball-reference.com

Sometimes the best laid plans go astray, so there’s no guarantee that the Yankees’ rotation will retain its youthful appearance throughout the entire season. After all, in 111 years, the Yankees have only had 25 pitchers start at least 30 games before their age-27 season, so, it would be remarkable if the team had three in 2012. Should Pineda, Hughes, and Nova all reach that plateau, however, it would be only the second time in franchise history that a trio of young pitchers accomplished the feat. The only other occasion took place in 1966, when Al Downing, Fritz Peterson, and Mel Stottlemyre combined to start 97 games. However, that group went a dismal 34-42, and the team lost 89 games. So, needless to say, Brian Cashman is probably banking on greater success from his trio of young starters.

Total Number of Starts by Yankees’ Pitchers Age-26 and Under, 1901-2011

Note: Red data points indicate years the Yankees won the World Series.
Source: Baseball-reference.com

The chance of Hughes, Nova, and Pineda all surpassing 30 games started is probably slim, but even if the barometer is lowered to 25, the 2012 rotation would still become only the sixth in franchise history to have three pitchers age-26 or younger qualify. What’s more, with at least 75 starts from the baby faced trio, you’d have to go all the way back to 1982 to find another season in which more games were started by pitchers no older than 26 years.

For most of the past decade, the advanced age of the Yankees’ rotation has been looked upon as a concern, but the team has enjoyed considerable success with older starting pitchers. In fact, in 2008, the only recent season in which the Yankees failed to make the playoffs, the team tried to inject youth into the rotation with Phil Hughes and Ian Kennedy (Joba Chamberlain joined the starting staff in June), but a combination of injuries and ineffectiveness limited the trio to only 29 starts. That’s why there should be at least a little trepidation about entering this season with such an inexperienced rotation. Although the potential in the Yankees’ young starting staff is encouraging (not only for this season, but beyond), the promise of youth is often broken. Besides, at the end of the season, the only stat that will count is the number of wins, not how games are started by the youngest members of the rotation.

Lost In Translation?

Will Hiroki Kuroda's success translate in the Bronx? (Photo: AP)

Because it came in the wake of the Yankees’ blockbuster trade for Michael Pineda, the acquisition of Hiroki Kuroda has been somewhat overlooked. Even now, the Japanese right hander seems to be getting short shrift on his own team. Recently, Yankees’ pitching coach Larry Rothschild identified Pineda and Ivan Nova as candidates for the number two slot in the rotation. However, if A.J. Burnett is traded and Freddy Garcia is sent to the bullpen, Kuroda will rank behind only CC Sabathia in terms of experience and success as a starter (Kuroda’s 114 games started are almost as many as Pineda, Nova, and Phil Hughes combined). What’s more, over the last two seasons, Kuroda has ranked 36th and 44th in bWAR and fWAR, respectively, which suggests the righty is a solid number two. So, why does it seem as if not too many people look upon him as being one?

Hiroki Kuroda’s Home/Road Splits

Source: Baseball-reference.com

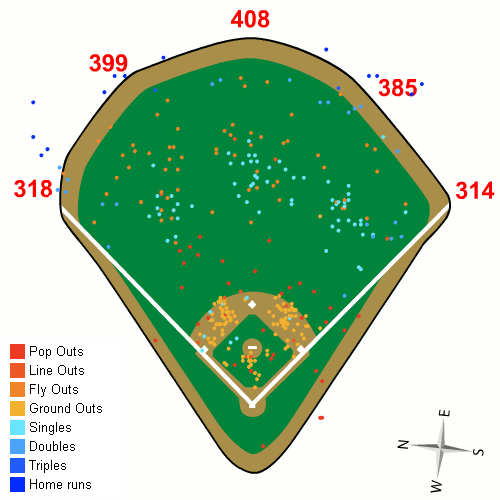
Although the Yankees acquisition of Kuroda has received some appreciation, there has also been hesitation expressed about his migration from the N.L. West to the more talent laden A.L. East. In addition, there have been concerns over the move from pitcher friendly Dodger Stadium to Yankee Stadium and its short right field porch, a fear heightened by the spike in Kuroda’s HR rate last season. However, during his Dodgers’ career, Kuroda hasn’t been a product of Chavez Ravine. Rather, he has pitched just as well on the road as home (3.43 ERA with .661 OPS against vs. 3.48 and .687). Also, an overlay of Kuroda’s batted balls at Dodger Stadium transferred to Yankee Stadium reveals only two additional HRs (doubles in Los Angeles that would have cleared the left field wall, not the short porch, in the Bronx), which hardly suggests a potential long ball epidemic.

Yankee Stadium Overlay of Kuroda’s Batted Balls at Dodger Stadium

Source: http://katron.org/projects/baseball/hit-location/

There are obvious drawbacks to an overlay, including variables like atmospheric conditions and ballpark-impacted pitch selection (not to mention the accuracy of the simulator). Also, the general trends in Kuroda’s batted ball data suggest an increase in both line drives and fly balls, which doesn’t bode well for his ability to keep opposing hitters in the park. Over his first three seasons, the right hander was able to induce ground balls more than half the time, but in 2011, that rate dropped all the way to 43%. Perhaps more concerning was the precipitous rise in line drives, which seems to justify the spike in Kuroda’s HR rate.

Hiroki Kuroda’s Batted Ball Data

Source: fangraphs.com

Does Kuroda’s move toward being more of a fly ball pitcher represent the start of new trend? It’s hard to tell from one year’s worth of data, but a closer look at the home runs he allowed in 2011 might suggest the increase was more of a fluke. Exactly half of the 24 homers allowed by Kuroda came with two strikes, which was more than double the five he allowed in the two seasons prior.

“I think it’s a random spike, given the information available,” said Joe Sheehan of Sports Illustrated. “The homers themselves were clustered in few outings–the chance that it’s some kind of skill issue is less than it just being a blip.”

In fact, Kuroda’s struggles with two strikes weren’t confined to the long ball. With the exception of 0-2 counts, opposing batters hit well above average against the veteran pitcher in every other two strike combination (click here for a look at how hitters performed with two strikes in 2011). If Kuroda is able to cut down on the damage against him with two strikes, not only might his HR rate return to more normal levels, but his performance could improve across the board. It’s hard to predict whether or not he will be able to make the adjustment, but perhaps pitching against stiffer competition in a more hitter friendly environment will improve his concentration (i.e., pitch selection) with two strikes on the batter? That’s all conjecture, but regardless, Kuroda has substantial room for improvement in two strike counts.

Hiroki Kuroda’s Performance with Two Strikes, 2011

Note: sOPS+ measures Kuroda’s performance against the league average in a particular split. For example, his sOPS+ of 121 in all two strike counts indicates opposing batters hit 21% better against him.
Source: baseball-reference.com

Another concern expressed about Kuroda’s transition to the Yankees is the impact of the team’s porous infield defense. However, according to UZR/150 (which, admittedly, is far from an exact barometer), Yankees’ infielders were at least on par with the Dodgers’ at every position but short stop. Also, based on advanced analyses like Mike Fast’s recent study on catcher framing, Russell Martin ranks as one of the best defensive backstops in the game (according to Fast’s framing data, Kuroda’s catcher in 2011, Rod Barajas, ranked toward the bottom in 2011). Finally, as a group, the Yankees’ outfield led the majors with a UZR/150 of 10.2, which was well above the Dodgers’ rate of 2.8. So, even if Kuroda has gradually become more of a fly ball pitcher, that could play to his advantage on the Yankees, especially if he can get opposing batters to hit the ball to Brett Gardner.

Comparison of Yankees and Dodgers Infield and Outfield Defense, 2011

Source: fangraphs.com

Defense is always an important part of the equation when evaluating pitching, but in Kuroda’s case, it might be a little overrated. Because of his age, and perhaps the perception that he is a control specialist, many people seem to regard Kuroda as a contact pitcher. However, over the last two years, he has proven to be adept at missing bats. Among all qualified pitchers spanning the last two seasons, Kuroda ranks ninth with a swinging strike rate of 10.5%, or two percentage points higher than the league average. If Kuroda can continue to fool hitters, especially during the period when they are learning his patterns, his ability to generate swings and misses could mitigate some of his defense’s shortcomings, if they do exist.

Swinging Strike Rates, 2010-2012

Source: fangraphs.com

There are usually many unanswered questions when a player transitions to a new team and league, so skepticism surrounding Kuroda’s ability to maintain his success in the Bronx is only natural. However, based on his track record and the Yankees’ short-term commitment, there’s every reason to be optimistic that the right hander will be a positive contributor in 2012. Will he be the number two? Such distinctions really have little relevance in the grand scheme of a 162-game season, but if the sentiments expressed by those who know him best are accurate, I wouldn’t bet against it.

Older posts            Newer posts
feed Share on Facebook Share on Twitter Share via email
"This ain't football. We do this every day."
--Earl Weaver