

If Bobby Grich had signed with the Yankees, Reggie Jackson’s star would have never made it to New York.
Sometimes, the best trades or free agent signings are the ones a team doesn’t make. Many Yankee fans seem to feel that way about the team’s decision to let Robinson Cano head west to Seattle. Is that wishful thinking? Perhaps, but considering the team’s eager willingness to trade him earlier in his career, such an outcome would be par for the course.
What about the flip side? When it comes to transactions not made, is relief really more common than regret? Or, are opportunities lost just as impactful as serendipitous gains? Since the advent of free agency in 1976, no team has been more active on the open market than the Yankees, so there are plenty of case studies to consider. Listed below are some of the higher profile transactions that the team seriously considered, but never made, accompanied by alternatives that were implemented, when applicable, and an evaluation of how the net result influenced the course of franchise history.
1976: Yankees pursue free agent Bobby Grich, but settle on Reggie Jackson as a consolation.
Background: Baseball’s first free agents were subject to a very different system than today. Instead of simply hitting the open market, players filing for free agency would enter what was known as a re-entry draft. Teams would then select players in a pre-determined order, much like the amateur draft, but instead of acquiring exclusivity, they would simply be granted the right to negotiate. Because only 12 teams could select any one potential free agent, the draft process effectively cut the player’s market in half. In addition, individual teams could only sign two net new free agents (i.e., if a team lost a free agent, it could sign three). These limitations were intended to limit competition for players, but they wound up constraining supply more than limiting demand. Exponentially higher salaries were the result.
Fresh off a World Series sweep at the hands of the Reds, the Yankees entered the winter seeking a player who could put them over the top. As it turned out, Reggie Jackson fit the bill perfectly, but he wasn’t the Yankees’ first choice. When it came time to make their first selection in the re-entry draft, the Bronx Bombers went with Orioles’ gold glove 2B Bobby Grich (Jackson was selected sixth, but that was partly due to the relative lack of interest from teams who knew they would not be able to sign him). The only problem for the Yankees was Grich was intent of playing close to his home in Long Beach. So, when Grich reached an accord with the California Angels, the Yankees shifted their focus to Jackson and signed him shortly thereafter.
Outcome: In five years with the Yankees, Jackson was the straw the stirred the drink. From 1977 to 1981, the right fielder posted an OPS+ of 148 and was a key contributor to two World Championships, including being named MVP of the Fall Classic in 1977.
Over the span, Bobby Grich was equally impressive with the Angels, compiling an OPS+ of 128 and playing strong defense at second base. In 1979, Grich also helped the Angels win their first division title.
Verdict: Although the Yankees very well might have enjoyed similar success with Grich, it’s hard to imagine the second baseman (who would have played short stop for the Yankees) providing more value than Jackson. Also, when you consider the contributions of Willie Randolph and Bucky Dent during the five years in question, it seems clear that the Yankees’ plan B in 1976 turned out to be the best course of action.
1982: Sign Floyd Bannister, trade Ron Guidry to Texas for Buddy Bell, or Ron Guidry or Dave Righetti to Kansas City for George Brett, and deal Graig Nettles to San Diego for a minor leaguer (the quality of which would depend on how much of Nettles’ $500,000 salary the Yankees were willing to eat)

1983 almost had Brett in pinstripes instead of pine tar?
Background: After a disappointing fifth place finish in 1982, the Yankees were looking to shake things up in the offseason, with Floyd Bannister being the linchpin to a series of dramatic moves. The Mariners’ 27-year old lefty was coming off a season in which he led the league in strikeouts, making him one of the most coveted players in the re-entry draft. If the Bronx Bombers were able to sign Bannister, news reports suggested they would then flip Guidry or Righetti for either Bell or Brett and jettison Nettles for a minor leaguer.
Considering all of the moving pieces involved, it’s hard to know whether the Yankees could have executed the plan, but it was all made moot when Bannister signed with the White Sox. So, instead of the exciting chain of events that might otherwise have unfolded, the Yankees’ winter shopping consisted of signing Don Baylor and Steve Kemp.
Outcome: Over the term of his five year deal with the White Sox, Bannister proved to be a solid contributor, (200 innings in all but one season; ERA+ of 107), but hardly the cornerstone of a rebuilding process. Both Guidry and Righetti proved to be more valuable pitchers over the span, albeit not by much.
It’s hard to believe Brett was really available. However, if the Yankees failed to do everything in their power to obtain him, it was a big mistake as the third baseman posted an OPS+ of 148 from 1983 to 1987 and remained one of the best players in the game throughout the rest of the decade. Although a more modest performer with an OPS+ of 108, Bell would have also represented a big upgrade for the Yankees, who wound up losing Nettles via free agency after the following season. It would take nearly a decade for the Yankees to acquire another third baseman of similar stature.
Verdict: In just about any iteration, the Yankees would have benefitted greatly from this deal. The acquisition of Bell would have more than offset the downgrade from Guidry to Bannister, while the idea of Brett in pinstripes seems as cataclysmic now as it must have then. Was such a deal really on the table? If so, the Yankees’ failure to consummate it qualifies as one of the team’s worst non-moves.
1985: Trade Don Baylor for Carlton Fisk
Background: In 1985, Carlton Fisk posted career highs in home runs and RBIs, but the White Sox were not eager to sign their 37-year old catcher to a long-term deal. Instead, they worked out a sign and trade with the Yankees, whereby Chicago would ink Fisk to a new deal and then flip him to the Bronx Bombers for disgruntled DH Don Baylor. However, Baylor had a no-trade clause, and he wouldn’t waive it unless Chicago sweetened the deal. Team co-owner Eddie Einhorn angrily balked at the request, proclaiming, “Let him stay with the Yankees”.
Baylor did stay with the Yankees, but only for another month, at which time he was dealt to the Red Sox for Mike Easler. Fisk’s staying power was much greater. Not only did the catcher sign a new two-year deal that offseason, but he remained with the White Sox for the final eight years of his career.
Outcome: Baylor had a solid year for the Red Sox in 1986 and provided above average offense over the next two, but the Yankees made out better with Easler. However, over the longer term, Fisk would have proven to be a better replacement. Despite having the worst season of his career in 1986, Fisk posted an OPS+ of 112 over the next five campaigns, which easily dwarfed the Yankees’ output from their catchers over that span.
Verdict: Assuming the Yankees had kept Fisk for more than two years, they would have easily come out the victor if Baylor had agreed to waive his no trade clause. Would Fisk’s production and leadership have made a difference on Yankee teams that came up short from 1986 to 1988? We’ll never know, but the value he provided at a very weak position for the Yankees would have made the team even more competitive during those years.
1986: Sign any or all of the following free agents: Tim Raines, Jack Morris and Andre Dawson

Jack Morris offered his services to the Yankees in 1986. They said no.
Background: During the winter of 1985, many of the best players in the game filed for free agency, but strangely, they attracted little interest around the league. Nearly every free agent that off season not only ended up re-signing with their current team, but they did so at terms well below recent norms. The same situation arose in 1986, but this time players were even more desperate to drum up a market. Jack Morris, then regarded as one of the best pitchers in the game, was so exasperated by the process that he offered his services to a list of five teams headed by the Yankees. Every single one turned him down without even discussing the terms. Morris was eventually forced to accept the Tigers’ offer of arbitration.
Tim Raines and Andre Dawson ran into the same difficulties as Morris, but the Expos’ outfielders didn’t relent as easily. Each outfielder refused to accept arbitration or re-sign with Montreal by the January 7 deadline, making them ineligible to return to the team until May 1. Faced with the prospect of not playing for a month, Dawson practically gave the Cubs a blank contract with his signature on it. Meanwhile, Raines waited patiently for another team to show interest. None ever did, and the outfielder was back in Montreal when the calendar turned to May.
Outcome: Raines, Dawson and Morris all had stellar seasons in 1987, and the two outfielders remained very productive for several years thereafter. However, it wouldn’t have taken a long-term deal to sign either or all three. By simply offering fair market value, the Yankees could have added as many as three All Stars to a team that won 90 games in 1986.
Verdict: By colluding with other teams to depress player salaries, the Yankees forfeited a chance to improve their team and prolonged a postseason drought that would last another eight years. The organization’s short sightedness also exposed the league to a costly lawsuit settlement and years of labor acrimony. Considering all the downside to saving a few extra dollars, the winter of collusion is the most glaring example of the worst moves being the ones you don’t make.
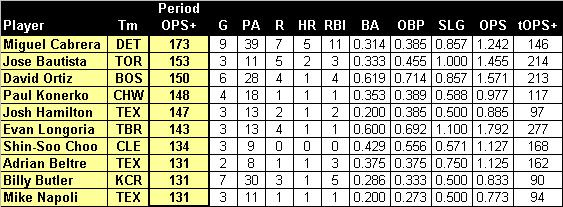
1992: Sign Barry Bonds and Greg Maddux
Background: The previous four seasons had been among the worst in Yankees’ history. After the suspension of owner George Steinbrenner, the team had retrenched and embarked upon a rebuilding process that was just starting to yield dividends. So, with the Boss on his way back from exile, and the Yankees’ farm system stocked with the talent, the team planned a master stroke. That winter, the free agent market was headlined by one of the best pitchers and hitters in the game…players who seemed destined to rank among the all-time greats.
The Yankees aggressively courted Barry Bonds and Greg Maddux, but GM Gene Michael couldn’t reel in either. Bonds’ contract demands, particularly his insistence on more than five years, proved too rich for the Yankees, while Maddux took less money to play in Atlanta. As a result, the team was forced to explore other options, which turned out to be Wade Boggs and Jimmy Key.
Outcome: Boggs and Key proved to be valuable consolation prizes, and were important contributors when the Yankees won the World Series in 1996, but Bonds and Maddux each continued on their paths toward immortality and, in the case of the former, infamy.
Verdict: If the Yankees had been able to sign either or both, it stands to reason that their ascendency toward the top of the baseball world would have been expedited. Having said that, it’s hard to imagine the team being more successful from that point forward, so, even though the franchise would have been given a boost in the early part of the decade, most Yankee fans probably wouldn’t want to change how the rest of it unfolded.
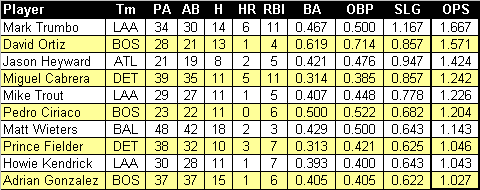
1998: Sign Albert Belle; let Bernie Williams go
Background: The Yankees had just completed one of the greatest seasons in baseball history, and Bernie Williams was at the forefront. That year, Williams won the batting title, gold glove, and posted the league’s second highest OPS+ at 160. It was the perfect time to be a free agent.
The Yankees initial offer to Williams was for five years and $37.5 million (eventually raised to $60 million), but the center fielder wanted something closer to seven years and $90 million. The gap was so wide, the team prepared to move on by courting Albert Belle, the only player in the A.L. with an OPS+ higher than Williams in 1998. Then, the Red Sox stepped into the fray, offering Williams the terms he wanted. Around the same time, the Orioles trumped the Yankees’ offer for Belle, so now even their backup plan was on shaky grounds. For whom would the team up the ante?
Before agreeing to the Red Sox offer, Williams made a last ditch effort to keep his pinstripes by calling George Steinbrenner directly. By the end of the call, the Yankees essentially matched the Red Sox offer, keeping Williams in the Bronx for seven more years.
Outcome: Williams was an elite performer for the first four years of his new deal, and over the full term provided value commensurate with his salary. The center fielder was also a key part of two more World Series victories and ended his career as one of the most prolific post season performers in baseball history. Meanwhile, Belle, who signed with the Orioles for five years and $65 million, had a very strong 1999 campaign, but only played two more years because of a debilitating hip injury.
Verdict: It’s a good thing the Yankees didn’t put plan B into action. The loss of Williams’ consistent excellence over the next four years, and the likelihood of Belle’s chronic hip flaring up in the Bronx, would have removed a pillar from the Yankees’ dynasty and, perhaps, caused it to fall much sooner.
This example most closely resembles the Yankees’ recent decision to effectively replace Robinson Cano with Jacoby Ellsbury (or Carlos Beltran). Interestingly, if the Yankees had increased their last offer to Cano in line with the bump given to Williams (approximately 40% in years and total value), the terms would have matched Seattle’s. However, this time, no phone call was made, and, considering the Yankees’ posture, it probably wouldn’t have been well received anyway. Now, the Yankees have to hope they can replace Cano’s remarkable consistency, which was also a hallmark of Williams.
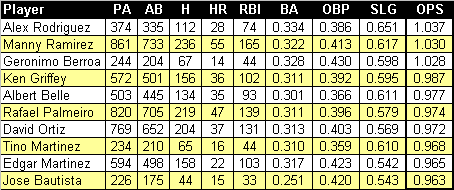
2003: Claim Manny Ramirez from irrevocable waivers
Background: Manny Ramirez was an extremely productive member of the Red Sox’ lineup, but his mercurial behavior often left the team exasperated. So, after a crushing loss to the Yankees in the 2003 ALCS, the Red Sox determined it was time to go in another direction, which meant shedding the remaining four years of Ramirez’ contract. To bring that about, Boston placed Ramirez on irrevocable waivers, essentially making him available to any team who was willing to pay the slugger $20 million per year.
Outcome: No one claimed Ramirez, who posted an OPS+ of 149 over the next four seasons and played a vital role in two World Series victories for the long suffering Boston franchise. Although the Red Sox relationship with Ramirez ended acrimoniously, they didn’t part company until 2008, when the Red Sox extended his contract by picking up one of the two team options attached to the original deal.
Verdict: The Yankees’ failure to claim Ramirez was mitigated by the signing of Gary Sheffield, who essentially matched the Red Sox slugger at half the cost in 2004 and 2005. However, Ramirez had greater staying power, and, by plucking him from Boston, the Yankees would have benefited from removing one of their chief tormenters from a bitter rival. On the whole, the Yankees would have been a better team with Ramirez during the four years that remained on his deal, and their relative supremacy over the Red Sox would have likely been extended.
2004: Sign Carlos Beltran instead of trading for Randy Johnson

Will the second time be a charm for the Yankees and Beltran?
Background: The Yankees were hoping to wash away the bitter taste of their collapse in the ALCS with a big acquisition in the off season, and two long coveted players just so happened to be available that winter. However, the team decided that it could only afford to add one, so the Bronx Bombers passed on Carlos Beltran, who offered the team a discount, in favor of trading for Randy Johnson.
Outcome: In 2005, Randy Johnson was the anchor of an otherwise shaky rotation, and his 5-0 record against the Red Sox turned out to be a crucial reason why the Yankees bested their rival for the division title. After that season, however, the Big Unit petered out in pinstripes and was traded back to the Diamondbacks one year later. In contrast, Beltran posted an OPS+ of 130 over the seven years of the deal he signed with the Mets, although two seasons were cut short by injury.
Verdict: Although Beltran provided much more value than Johnson, in 2005, the Big Unit helped the Yankees rebound from their ALCS collapse. Also, Johnny Damon, whom the Yankees likely would not have signed with Beltran in the fold, helped make up some of the void left in centerfield. On the whole, however, it’s hard to argue that the Yankees wouldn’t have been better off with Beltran. Brian Cashman is undoubtedly hoping that the same is true this time around, making the Yankees recent acquisition of the switch hitter a case of better late than never.
2007: Trade for Johan Santana
Background: It had been seven years since the Yankees last won the World Series, and the team’s lackluster starting pitching was the main culprit. So, with the Twins dangling Johan Santana, it seemed a certainty that the Yankees would backup the truck for the talented left hander. Joba Chamberlain, Phil Hughes, Ian Kennedy, Melky Cabrera, Robinson Cano, and Austin Jackson were all coveted by the Twins, and it was reported that the Yankees would have to part with at least three to make a deal. That price proved to be too steep, especially considering some of the concerns the team had about Santana’s durability. So, instead of trading for the ace they so desperately needed, the Yankees allowed the Mets to swoop in and claim that winter’s biggest prize.
Outcome: After the 2008 season, it looked as if the Yankees had blundered badly. Santana finished third in the NL Cy Young race, while the Bronx Bombers missed the playoffs for the first time since 1993. However, Santana began to regress and never again threw 200 innings in a season. In addition, all of the players on the Twins wish list contributed in varying degrees (either in pinstripes or as a trade chip) to the Yankees’ future success.
Verdict: Passing on Santana proved to be the right decision, regardless of the package sent to Minnesota, although including Cano in the deal would have been catastrophic. By keeping all of their prospects and signing a healthier ace the following season, the Yankees quickly rebounded in 2009, winning their 27th World Championship with Sabathia, Cabrera, Cano, Hughes, and Chamberlain all playing a key role.
2010: Sign Cliff Lee
Background: The Yankees tried to acquire Cliff Lee at the 2010 trading deadline, but the deal fell through when David Adams’ medical report revealed a red flag. The Yankees weren’t willing to amend the deal, so the Mariners traded Lee to Texas instead. After watching Lee dominate them in that year’s ALCS, the Yankees were determined to sign the lefty during the off season. However, Lee was more interested in beating the pinstripes than wearing them, so he took less money to join the Phillies.
Outcome: In the three years since signing the deal, Lee has remained one of the best pitchers in baseball, posting an ERA+ of 139 in over 660 innings. Not only would he have made the Yankees a better team during that period, but the left hander would also fill the void in the team’s starting rotation that remains today.
Verdict: Because Lee turned down the Yankees, the team can’t be blamed for inaction. However, had the club been willing to sweeten its offer to the Mariners during the 2010 season, he may have been more amenable to remaining in the Bronx that off season. As a result, that initial reticence has become a source of regret for Yankee fans, and, perhaps, Brian Cashman as well.