"A New York Treasure" --Village Voice
Tag: color by numbers
Older posts           

Color By Numbers: Historical Look at 2012 Postseason Participants

Thanks to the new dual wild card format, 10 teams have a chance at making it to the World Series. Of course, by late Friday evening, two clubs will already be making plans for next season. In any event, listed below is a breakdown of the playoff history for each team who will be vying for the 2012 MLB championship.

Historical Post Season Records

Source: Baseball-reference.com

From a historical perspective, this postseason resembles a roundup of the usual suspects. Five of the top six franchises in terms of playoff appearances are represented this October, including the Yankees, who will be making their 51st run at a championship. Among teams who entered the season with 20 or more playoff appearances, only the Dodgers and Red Sox failed to join the party. In addition to being long time October combatants, most of these postseason regulars have also been recent participants, with all but the Athletics having made a prior playoff appearance within the last two years.

Grouped together in the middle of the October roll call are the Tigers, Reds, and Orioles, three teams that have had varying degrees of more limited playoff exposure. Although Detroit has only made the postseason in three of the past 25 years, this season marks the first consecutive playoff appearance since 1935, when Charlie Gehringer and Hank Greenberg lead the Tigers to the championship. Cincinnati’s N.L. Central crown marks the franchise’s fourth October appearance since the last days of the Big Red Machine in 1979, but the team can boast two division titles in the last four years. Finally, the Orioles are not only making their first playoff appearance in 15 years, but also coming off their first winning regular season over the same span.

At the bottom of the totem pole is the Nationals, who are making only the second playoff appearance in franchise history and first since the strike shortened 1981 season when the team played in Montreal. What’s more, Washington D.C. will be hosting playoff baseball for the first time since the 1933 World Series.

The Texas Rangers contributed to Washington’s thirst for October baseball when the team played as the Senators from 1961 to 1971. Since its inception, the franchise has now made the playoffs only six times, but this year marks the third consecutive season of October action in Arlington. Of course, after blowing a big division lead, the two-time defending A.L. champs may not feel as is they’ve made the postseason until (and if) they advance to the ALDS against the Yankees.

Longest Championship Droughts, By Team (30 Years or Longer)
 

Source: baseball-reference.com

There are several intriguing World Series match-ups that could result from the field of playoff participants. The Yankees versus Cardinals would feature a showdown between each league’s most successful franchise, while a match-up between the Yankees and Giants would provide a historical nod to the glory days of baseball in New York. If the Nationals and Rangers square off, it would ensure the first championship for one of the franchises. Between them, the two teams currently have 92 fruitless seasons (only three Fall Classics have featured two teams with a longer combined dry spell), so if they meet in the World Series, one of the longest current droughts would come to an end. The Nationals versus Orioles would constitute a very unlikely “Battle of the Beltway”, while the Athletics and Giants would reprise the “BART Series”. However it shakes out, if October turns out to be as exciting as September, baseball fans are in for quite a treat.

[Featured Image: Ed Zurga/Getty Images North America]

Color by Numbers: Beware of Yankee Killers

Miguel Cabrera has been a one-man wrecking crew against the Yankees this season. In 39 plate appearances, the third baseman has cranked out 5 home runs and 11 RBI to go along with a scary slash line of .314/.385/.857. Among players with at least 20 times to the plate against the Yankees, Cabrera’s OPS ranks fourth this season, which has led some to suggest Joe Girardi should put up four fingers every time he comes to bat. Unfortunately, following him in the lineup is Prince Fielder, whose OPS against the Bronx Bombers isn’t that far behind. For Yankees’ pitchers, at least, the season series against the Tigers can’t end soon enough.

Top-10 OPS vs. Yankees, 2012

Note: Based on minimum of 20 plate appearances.
Source: Baseball-reference.com

After the Yankees were shutdown by Felix Hernandez and Justin Verlander within three days, many lamented the team’s perceived inability to hit great pitchers. However, based solely on observation, it seems as if great hitters have caused a much greater problem. It’s difficult to test such a hypothesis because of the subjective criteria involved, but we can give it a try anyway.

Top-10 Hitters in the American League (2010-Present) vs. Yankees in 2012

Note: Top hitters based on OPS since 2010 and a minimum of 1,200 plate appearances. Robin Cano excluded.
tOPS+ is OPS of this split relative to the player’s overall OPS, with variance from OBP and SLG determined separately and added together.
Source: Baseball-reference.com

Using OPS+ over the past two-plus seasons as a gauge, the Yankees record against the 10 best hitters in the American League is presented above. Not surprisingly, Cabrera ranks as the best hitter in the game, so the Yankees have not been his only victim. However, Cabrera has posted an OPS versus New York that is 46% higher than his season rate, which is in line with the premium he has enjoyed over the Yankees for his entire career.

As great as Cabrera has been against the Yankees, his performance is pedestrian compared to David Ortiz, who is batting an astounding .619 against the pinstripes. In much smaller samples, Evan Longoria and Jose Bautista have exceeded their typical production by an even greater percentage than Ortiz, but based on the number of at bats, Big Papi has been hands down the most deadly offensive weapon used against the Yankees this season.

Although most of the top-10 hitters have managed to exceed their already high baseline against the Yankees, Josh Hamilton, Billy Butler, and Mike Napoli have all been below par. Keep in mind, however, that the samples for Hamilton and Napoli are very small, so the Yankees shouldn’t enter next week’s four game showdown against Texas with a false sense of security.

Top-10 OPS vs. Yankees, 1988-Present

Note: Based on minimum of 200 plate appearances.
Source: Baseball-reference.com

Fans who are one generation older probably immediately think of Edgar Martinez when it comes to ranking top Yankee killers from the recent past. However, the Mariners’ DH only ranks ninth in OPS against the pinstripes, and his .965 rate versus the Yankees is only marginally better than his career output. Instead, one of his former teammates owns the distinction of being the most prolific tormentor of the Yankees over the past 25 years. You may have a heard of him…his name is Alex Rodriguez. In 372 plate appearances versus New York, Arod’s 1.037 OPS ranks just ahead of Manny Ramirez (who had more than twice as many chances). Maybe that’s why some Yankee fans still refuse to accept him?

Confirming our earlier suspicion, the Yankees do seem to have trouble with great hitters. Of the 10 hitters with the highest OPS against them since 1988, nine were All Stars and at least six have borderline or better Hall of Fame credentials. Then, there is Geronimo Berroa. The journeyman outfielder was a solid player for 11 seasons, but his career OPS of .798 belied the monster he was against the Yankees. In 244 plate appearances, Berroa’s line of .328/.430/.598 added up to an OPS that was 56% better than his career rate. In particular, Berroa enjoyed facing Andy Pettitte, against whom he compiled an OPS of 1.317 in 29 plate appearances. Perhaps the most resounding evidence of his Yankee domination, however, is his .896 OPS against the immortal Mariano Rivera (the 17th highest rate by any player with at least 14 PAs against the great closer).

By the end of the next season, Miguel Cabrera should have enough plate appearances to take his place among the top Yankee killers of recent vintage as presented in the chart above. Of course, if the Yankees can finally find a way to get him out, maybe his OPS won’t be high enough to qualify? That’s probably wishful thinking, but for one more game this afternoon, is it too much to ask for an 0-4?

Color By Numbers: Yankee, Go West

It was almost the West Coast trip from hell. After dropping five of six in Oakland and Seattle, not to mention losing Alex Rodriguez to a broken hand, the Yankees were poised for another defeat on Wednesday afternoon. However, Jayson Nix’ bases clearing double in the eighth inning wiped away a 2-1 deficit, and with it, some of the sting of a difficult road trip.

If not for Nix’ heroics, the Yankees would have recorded their second lowest winning percentage on any West Coast trip of at least six games. By squeaking out a win, the Bronx Bombers also nudged their all-time record in the Pacific timezone to just over .500 at 385-384.  Although Yankees’ fans are seldom satisfied with mediocrity, that record might come as a pleasant surprise because trips out West have always seemed to have more than their share of misadventures.

Winning Percentage Distribution of Yankees’ West Coast Trips, 1968 to 2012

Note: Includes trips involving two or more cities.
Source: Baseball-reference.com

The Yankees’ first regular season game on the West Coast took place on May 5, 1961, when the Bronx Bombers traveled across the country to face the expansion Los Angeles Angels. Media accounts expected the Yankees to romp over the Angels, especially considering the friendly confines of Wrigley Field (there was one in Los Angeles too). Although the AP compared the mighty Yankees’ visit to “letting a channel swimmer work out in bath tub”, Casey’s crew wound up losing two of three in the series and six of nine against the Angels in Los Angeles overall.

Since the Angels joined the American League, the Yankees have played 769 games in the Pacific Time Zone as part of 126 distinct trips. Until the Athletics moved to Oakland in 1968, visits to the West Coast were basically three game stopovers amid longer road trips that included cities like Cleveland, Minnesota, and Kansas City. Then, when the Pilots landed in Seattle for the 1969 season, the jaunt became a lengthy swings up or down the coast. In 1970, East Coast teams were given a bit of a reprieve when the Pilots relocated to Milwaukee, but the three-city circuit became a staple when the Mariners joined the A.L. in 1977.

With Seattle back in business, the three-city trip along the Pacific became a rite of passage for A.L. teams until the next round of expansion in 1998. Since that time, the Yankees have only made one trip covering all three cities. In fact, with the exception of the nine-game jaunt in May 2011, last week’s seven-game trip out West was as long as any other from the past 14 seasons.

Yankees’ Winning Percentage on the West Coast, by Decade, 1961 to 2012

Note: Includes all games played in the Pacific timezone.
Source: Baseball-reference.com

So, if this most recent West Coast swing almost qualified as the second worst in Yankees’ history, what was the worst? On May 23, 1995, the Yankees, who trailed the Red Sox by 1.5 games at the time, lost the first game of a three-city tour in a 10-0 blowout at the hands of Chuck Finley and the Angels. However, there was a silver lining, albeit one that wouldn’t pay off until the following year. In need of a spot starter, the Yankees promoted a skinny Panamanian kid named Mariano Rivera. Although the loss presaged the kind of trip the Yankees would have, Rivera’s debut turned out to be the more important omen.

The Yankees wound up losing the first five games of the trip before finally getting a win in Oakland behind, you guessed it, Rivera, who, this time, allowed only one run over 5 1/3 innings (the losing pitcher was present day Yankees’ bullpen coach Mike Harkey). Unfortunately, the losing resumed as the Yankees were swept in three games at the Kingdome. By the time the Bronx Bombers limped onto the plane to head back home, the team had dropped seven games behind the Red Sox.

Incredibly, the Yankees followed up the disastrous trip to the West Coast with another epic failure when the team returned in August. This time, the Yankees eked out one more victory to finish the 10-game trip at 2-8. Combined with the three losses the team suffered to the Mariners in the ALDS, the Yankees ended 1995 with 3 wins against 19 defeats on the banks of the Pacific.

Yankees’ Worst West Coast Trip: May 23-31, 1995

Note: Based on winning percentage; minimum six games.
Source: Baseball-reference.com

One season before the Yankees’ nightmarish Western experience in 1995, the team compiled its most glorious visit to Anaheim, Oakland and Seattle. Following the All Star Break in 1994, the Yankees opened up the second half in the Kingdome, and, for eight innings, looked headed for defeat. Trailing 8-6 in the ninth, the Yankees’ rallied for seven runs and then seemingly never stopped scoring after that. In total, the Bronx Bombers scored 90 runs on the 10-game trip, culminating in Don Mattingly’s first and only pinch hit home run, which helped the Yankees erase another ninth inning deficit in the final game of the trip. The 9-1 stretch allowed the Yankees to build a 5 1/2 game lead in the A.L. East, putting the team in line for its first full season division title since 1980. However, it was all for naught. Less than three weeks later, the players went on strike and the season never resumed.

Yankees’ Best West Coast Trip: July 14-24, 1994

Note: Based on winning percentage; minimum six games.
Source: Baseball-reference.com

Color By Numbers: Kryptonite and Spinach

Superman had his kryptonite. Mariano Rivera had Edgar Martinez.  In 23 plate appearances against the immortal closer, the Mariners’ prolific DH batted an incredible .579/.652/1.053. When there’s a clash of the titans, someone has to win, and in this rare instance, the great Rivera was usually on the wrong side of the battle.

If Martinez was Rivera’s kryptonite, Ray Durham was his spinach. In 26 plate appearances against the closer, the former All Star 2B never got a hit. Although extreme in his level of futility, Durham has plenty of company among hitters who have been dominated by Rivera. Over 40% of the 83 players with at least 15 plate appearances against the all-time saves leader have posted an OPS below .600, so, just like a real life superhero, the Yankees closer is accustomed to getting his man.

Kryptonite and Spinach for a Selection of Top Pitchers
 
Note: Based on hitters with a minimum of 25 plate appearances (15 PAs for Rivera) against each starter. Includes post season results.
Source: Baseball-reference.com

The chart above lists the five hitters with the most and least success (i.e., the kryptonite and spinach) against Rivera as well as a selection of top starting pitchers from both the present and past. As you can see, the chief nemeses for an elite pitcher are often hitters of equal renown. For example, Bob Feller had Ted Williams, Randy Johnson had Albert Pujols, and Sandy Koufax was made human when facing the immortal trio of Hank Aaron, Stan Musial and Willie Mays. However, there are some anomalies, such as Steve Ontiveros’ success against Tom Seaver. In 28 plate appearances, the former corner infielder for the Giants and Cubs, who had a career OPS of .731, managed to more than double that rate when facing Tom Terrific. The same relationship also existed between Greg Maddux and Javier Valentin, a light hitting catcher who somehow managed to solve the riddle of the Braves’ right hander.

The Seaver/Ontiveros and Madduz/Valentin pairings are probably the most surprising from the chart above, but that doesn’t mean the other elite pitchers haven’t had their share of unlikely antagonists. Marco Scutaro has been one of Rivera’s more frequent tormenters, while teammate CC Sabathia has found Rod Barajas to be one of his toughest outs. Two light hitting infielders, Jose Lopez and David Eckstein, have given Roy Hallday headaches, while Jerry Hairston Jr. is on a very small list of hitters who had Pedro Martinez’ number. Very few pitchers have been more intimidating than Bob Gibson, but that didn’t stop one of the worst hitters in baseball history from dominating the right hander. No hitter with at least 4,750 plate appearances has an OPS+ lower than Tim Foli’s 64, yet, somehow the journeyman managed to bat .483/.516/.586 against Gibson. Not to be outdone, Neifi Pérez, who matched Foli’s infamy by posting an OPS+ of 64 in over 5,500 plate appearances, also picked on one of the game’s greatest pitchers. In 42 plate appearances against Randy Johnson, Pérez raised his game exponentially, batting .333/.333/.619 against the Big Unit.

Unlikely Antagonists

Note: Hitters selected based on a combination of plate appearances and OPS+. Includes post season results.
Source: Baseball-reference.com

The chart below displays the distribution of OPS rates compiled by batters with a minimum number of plate appearances against our selection of great pitchers (see note for explanation of criteria used).  Rivera and Clemens are the only two pitchers from the group to keep a hitter under an OPS of .100, while Clemens also scored the lowest percentage of hitters who racked up an OPS over 1.000. Among the starters, only Pedro matched Rivera in terms of the number of hitters with an OPS against below .700; Tim Lincecum is the leader of the actives. Finally, all but Feller, Sabathia, and Hernandez have more “blue” than “red” on their charts, but it should be noted that trio pitched more seasons in a higher run environment than all others but Rivera and Halladay.

“OPS Against” Distribution for Select Group of Top Starters

Note: Based on hitters with a minimum of 25 plate appearances (15 PAs for Rivera) against each starter. Also, a 7% OPS adjustment (based on a crude comparison of league OPS in the different eras) was used to approximate the lower run environment that existed during the careers of Seaver, Ford, Gibson, and Koufax. Includes post season results.
Source: Baseball-reference.com

Color By Numbers: International Pastime

Baseball used to be just the National Pastime, but now, America’s greatest game belongs to the world. Official Opening Day rosters haven’t been decided upon yet, but there’s a good chance the percentage of players born outside the United States could top 30% for the first time in history, further cementing baseball as the most diverse of the three major American sports (if Canadian and U.S. players are considered “domestic”, baseball’s international participation is  also greater than the NHL’s).

Comparison of International Participation Among Major Sports


Note: For NHL, domestic includes the U.S. and Canada.
Source: baseball-reference.com (2011); profootball-reference.com (2011-12); NHL.com (2010-11); rpiratings.com (NBA: 2011-12)

For much of its first 100 years, baseball was mostly composed of American born players. However, when Jackie Robinson broke the color barrier in 1947, that started to change. Soon after Robinson’s debut, an increasing number of international players, particularly those hailing from Cuba, Mexico, and Puerto Rico, began filtering into the league. As a result, the percentage of foreign born players increased from 3.6% in 1947 to 9.0% in 1961, the first year of expansion.

Domestic vs. International Participation in MLB, 1901 to 2011


Note: Data is not continuous, but based on five-year segments.
Source: Baseball-reference.com

With more teams came the need for a deeper talent pool, so over the next decade, international participation continued to trend up, reaching 12.5% by 1976, even though the number of Cuban born players was significantly curtailed by Fidel Castro’s revolution. Filling the void left by the absence of Cuban players was an influx of talent from Venezuela and the Dominican Republic as well as even greater participation from Mexico and Puerto Rico.

For the next 10 years, the number of international players remained stagnant. Perhaps not coincidentally, that was also the first decade of free agency. With a ready of supply of proven major league talent now regularly available, perhaps teams became less inclined to spend on international scouting? Whatever the reason, the number of foreign born players began to increase again in the mid-1980s, right around the time free agent salaries began to skyrocket. Since that point, the trend toward greater diversity has continued unabated.

Percentage of International Players, By Country


Note: Data is not continuous, but based on five-year segments. Percentages are based on international segment only.
Source: Baseball-reference.com

In 2010, the international presence in the major leagues peaked at 28.2% (the all-time high based on Opening Day rosters was 29.2% in 2005). Considering the increasing number of high profile international free agent signings and gradual development of foreign born prospects, both of those rates could be eclipsed in 2012, but for how much longer will the trend continue?

One of the key components of baseball’s new CBA is a provision that effectively creates a salary cap for amateur international free agent signings. Although not as extreme as folding foreign born amateurs into the Rule IV draft, this new system could have similar effects. In particular, there has been concern expressed about whether budgetary restrictions placed on international signings will discourage teams from investing overseas (i.e., why fund an academy if the ability to sign the prospects is limited?). Worth noting in relation to this concern is that since Puerto Rican players were added to the draft in 1990, the number of major leaguers hailing from the island has declined from 3.4% of all players and 24.3% of international players to 2.2% and 8%, respectively, in 2011. Needless to say, if a similar effect results from the new CBA, the percentage of foreign born players in the majors could reverse course.

Not only has there been a significant increase in the number of international players, but baseball has also experienced demographic shifts within the domestic population. For the first 30 years of the modern major leagues, the Rust Belt contributed the highest percentage of players, with Pennsylvania, Ohio, Illinois, and New York leading the way. By the 1930s, however, warmer weather states like California and Texas, which not coincidentally hosted some of the best minor leagues circuits in the country, began to take over.

Domestic Participation in MLB, 1901-2011


Note: Data is not continuous, but based on five-year segments.
Source: Baseball-reference.com

Baseball’s state demographics remained relatively stable from the 1930s to the 1960s, at which point the number of players hailing from California and abroad began to take its toll on the rest of the country. More recently, however, the Golden State’s share of the player population has started to abate, dropping from nearly 25% in the mid-1980s to the current rate of 16.1%. This decline allowed the number of foreign born players to surpass the individual rates of every state for the first time in 1996.

Over the past five years, there has been an uptick in the percentage of players born in Texas and Florida, which seems like a trend that will continue. On the other hand, every other state now falls below the 3% level, meaning nearly one in two American born players is a native son of California, Texas, or Florida. Of course, it should be noted that those states have three of the four highest populations, but even on a per capita basis, they rank among the leaders.

Per Capita Domestic Participation in MLB, Top- and Bottom-10, 2011


Source: Baseball-reference.com and 2010 U.S. Census data

Despite the increased concentration among domestic players, baseball’s international presence has fueled its unprecedented diversity. This melting pot has been a recipe for success, not only on the field, but in the board room as well. So, the next time someone tries to argue that baseball is no longer the National Pastime, just smile and nod your head. They’re right. Baseball is now the International Pastime.

Color By Numbers: Will Youth Serve the Yankees?

Now that A.J Burnett has been forced to walk the plank, the 2012 Yankees’ starting rotation has begun to take its final shape. Although Joe Girardi has promised a battle between the veteran Freddy Garcia and one-time top prospect Phil Hughes for the fifth slot, the young right hander seems to have the inside track. Then again, Hughes isn’t really that young any more, at least not by the standards of the Yankees’ 2012 rotation.

If Phil Hughes breaks camp as the fifth starter, he’ll no longer be the baby of the staff. Along with Ivan Nova (25) and Michael Pineda (23), Hughes would give the Yankees three starters no older than 26, providing a youthful complement to the 31-year old CC Sabathia and 37-year old Hiroki Kuroda. At an average age of 28.4, the 2012 rotation would represent the team’s youngest starting staff since 1995 and fourth youngest in the last 30 seasons.

Average Age* of New York Yankees’ Starters, 1901-2011

*A weighted average based on the number of innings pitched as a starter only.
Note: Red data points indicate years the Yankees won the World Series.
Source: Baseball-reference.com

Sometimes the best laid plans go astray, so there’s no guarantee that the Yankees’ rotation will retain its youthful appearance throughout the entire season. After all, in 111 years, the Yankees have only had 25 pitchers start at least 30 games before their age-27 season, so, it would be remarkable if the team had three in 2012. Should Pineda, Hughes, and Nova all reach that plateau, however, it would be only the second time in franchise history that a trio of young pitchers accomplished the feat. The only other occasion took place in 1966, when Al Downing, Fritz Peterson, and Mel Stottlemyre combined to start 97 games. However, that group went a dismal 34-42, and the team lost 89 games. So, needless to say, Brian Cashman is probably banking on greater success from his trio of young starters.

Total Number of Starts by Yankees’ Pitchers Age-26 and Under, 1901-2011

Note: Red data points indicate years the Yankees won the World Series.
Source: Baseball-reference.com

The chance of Hughes, Nova, and Pineda all surpassing 30 games started is probably slim, but even if the barometer is lowered to 25, the 2012 rotation would still become only the sixth in franchise history to have three pitchers age-26 or younger qualify. What’s more, with at least 75 starts from the baby faced trio, you’d have to go all the way back to 1982 to find another season in which more games were started by pitchers no older than 26 years.

For most of the past decade, the advanced age of the Yankees’ rotation has been looked upon as a concern, but the team has enjoyed considerable success with older starting pitchers. In fact, in 2008, the only recent season in which the Yankees failed to make the playoffs, the team tried to inject youth into the rotation with Phil Hughes and Ian Kennedy (Joba Chamberlain joined the starting staff in June), but a combination of injuries and ineffectiveness limited the trio to only 29 starts. That’s why there should be at least a little trepidation about entering this season with such an inexperienced rotation. Although the potential in the Yankees’ young starting staff is encouraging (not only for this season, but beyond), the promise of youth is often broken. Besides, at the end of the season, the only stat that will count is the number of wins, not how games are started by the youngest members of the rotation.

Color By Numbers: Show Me the Money

Alex Rodriguez stood alone as baseball’s only $200 million man for a decade, but now he has company. In the last six weeks, the fraternity has tripled with the addition of Albert Pujols and Prince Fielder. However, Arod still remains firmly planted atop baseball’s all-time salary totem pole.

10 Highest Paid Players in Baseball History, by Total Value and AAV

Note: Roger Clemens signed a pro-rated $28,000,022 deal with the Yankees in 2007, but he was only paid $17,400.000.
Source: Cots Contracts

If anyone was going to top Arod’s $27.5 million average annual salary, it seemed as if Albert Pujols would be the man. However, the new Angels’ first baseman “settled” on a contract that will pay him $24 million over the next 10 years, meaning he not only fell short of Arod’s current deal, but also failed to topple the contract Rodriguez signed with the Rangers in 2001. As a result, the Yankees’ third baseman seems to be a good bet to remain the highest paid player in baseball history for several more years.

Only two other players have had a longer reign as baseball’s all-time highest paid player. Babe Ruth remained atop the financial heap for 29 years, a period that began when he first joined the Yankees in 1920 and continued until 1949, when Ted Williams finally surpassed the $80,000 earned by the Bambino in 1930 and 1931. After the baton passed from the Babe to the Kid, Williams carried it for another 17 years until Willie Mays finally claimed the throne. Between that point and Arod’s mega-$252 million deal in 2001, the title of highest paid player repeatedly changed hands like a hot potato, with some players claiming the distinction for only days.

Yearly Progression of Baseball’s Highest Paid Player

Note: Records for the period before Babe Ruth are not as complete. Salaries represent average annual contract values with bonuses included. In some cases, actual contract values may have been higher or lower based on interest/inflation adjustments and performance incentives. The highest paid designation was awarded to the player with the top average annual salary before the start of each season.
Source: archival newspaper accounts

Because of Ruth’s immense talent, his salary almost became a defacto ceiling for future players’ demands.  In addition, the depression and World War II played a role in keeping players’ ambitions in check, as did the imposition of salary limits by the government’s Wage Stabilization Board during the early-1950s. Although players like Ted Williams and Joe DiMaggio finally surpassed the Babe’s benchmark and broke the $100,000 plateau during this period, it wouldn’t be until the mid-1960s when salaries started rise again.

In 1966, Willie Mays became the highest paid player in baseball history with a salary of $133,000, and then the dominoes started to fall. In the 1970s, a new player became the top man in almost every season, but in 1975, Catfish Hunter put them all to shame. After the 1974 season, Hunter discovered that Athletics’ owner Charley Finley had failed to fund an annuity as stipulated by his contract, so he claimed a breach and was eventually awarded free agency by an arbitrator. Fresh off four consecutive 20-win seasons, Hunter became the subject of a bidding war that was eventually won by George M. Steinbrenner. Hunter’s average contract value of $750,000 (his salary was much lower because of annuity deferments and other consideration) set the stage for the era of free agency that came to a crescendo when Tom Hicks handed out a whopping $252 million contract to Alex Rodriguez 25 years later.

For how much longer will Arod remain baseball’s salary king? This winter, Pujols and Fielder took their best shot at claiming the throne, but came up short. And, with more and more young superstars opting to sign long-term extensions before reaching free agency, it could be awhile before someone surpasses Rodriguez’s average annual salary of $27.5 million (which could wind up being even higher if certain milestone bonuses are achieved). Then again, with baseball enjoying unprecedented economic growth, maybe a $300 million/$30 million man is not that far away?

Color By Numbers: The One that Got Away

Whenever a team makes a trade involving a young prospect, there’s always a fear he’ll wind up becoming a superstar. Considering the potential of Jesus Montero, that concern had to be foremost on Brian Cashman’s mind as he agreed to send the young hitter to the Seattle Mariners in exchange for Michael Pineda, a very promising prospect in his own right.

Years ago, before the information age, prospects seemed to magically appear on the doorstep of the major leagues. Nowadays, however, fans have the ability to track a player’s progress from the moment he is drafted until he takes his first pro at bat, so it’s easy to understand why many develop an attachment to homegrown prospects. And yet, in most cases, the pent-up anticipation usually leads to disappointment.

Since 1901, 379 position players (includes actives) have made their major debut in pinstripes, but only 52 ended their careers with a WAR higher than 15. Of that subtotal, all but 13 either spent most of their careers with the Yankees or were traded after establishing themselves in the big leagues, including 20 of the top 21 on the list. So, for the most part, the Yankees have been pretty good at not giving away their best position player prospects.

The Ones That Got Away

Note: Includes players with a WAR greater than 15 who were traded by the Yankees early in their careers.
Source: Baseball-reference.com

The only discarded Yankee whose career WAR would rank among the franchise’s best homegrown talents is Dixie Walker. After compiling only 422 plate appearances in five seasons with the Yankees, the 25-year old Walker finally blossomed after being sold to the White Sox for $12,000 in 1936. At the time, the Yankees were a powerhouse team about to embark on a four-year championship run, so there was little room for Walker. However, the move still proved to be short sighted, but not until two other teams also passed him over. Once Walker landed in Brooklyn, his career finally took off. In nine seasons as a Dodger, the outfielder compiled an OPS+ of 128 and received MVP votes in seven years. Admittedly, most of Walker’s success came during the war years, but that makes his loss even more regrettable from the Yankees’ standpoint. Had the team not traded him so many years earlier, perhaps Walker’s presence in the lineup would have helped the Bronx Bombers weather the loss of so many others to military service and avoid what for the Yankees was a long World Series drought from 1944 to 1946.

Mike Lowell’s ranking on the list is perhaps the most relevant in light of recent news because, like Montero, he was traded as part of a prospect swap. At the time, the Yankees had a stacked offensive team and decided to make a new three-year commitment to 3B Scott Brosius, which made Lowell expendable. Unfortunately, Ed Yarnall, the pitcher the Yankees received in return, didn’t exactly pan out. After only 20 innings in the Bronx, the lefty was traded to the Cincinnati Reds before departing forJapan. Needless to say, Cashman is hoping Michael Pineda does a lot better.

Like Lowell, Jackie Jensen is another discarded Yankee who eventually made his bones in Boston. In 1951, Jensen had a very strong campaign in limited duty, which he parlayed into being named Joe DiMaggio’s replacement the following year.  Unfortunately for Jenson, that honor was short lived. In fact, it only lasted seven games. After hitting .105 during the first week of 1952, Jensen was traded to the Senators for Irv Noren. In the aftermath of the deal, Casey Stengel admitted that Jensen had talent, but stressed the Yankees’ need for a centerfielder who could “hit, run, field, and throw”. Of course, the irony was the Yankees already had someone on the roster who fit the description. His name was Mickey Mantle.

“We need a centerfielder who can hit, run, field and throw. I tried to give Jensen the job, but he couldn’t hit for me. I couldn’t wait any longer.” – Casey Stengel, quoted by the New York Times, May 4, 1952

Less than a month after the trade was made, Mantle was installed as the new center fielder and Noren was reduced to playing a utility role. Meanwhile, Jensen started to find his swing with the Senators, leading AP to suggest that the Yankees “pulled a whopper” by making a rare bad trade. Despite two solid seasons in Washington, Jensen really made his mark with the Red Sox. In seven seasons with Boston, the outfielder compiled an OPS+ of 123 and punctuated his career with an MVP in 1958.

Consider this.

Although his name appears at the bottom of the list, Jay Buhner probably stand outs to most fans as the best example of the Yankees trading away a promising young hitter. Seinfeld is largely to thank for that, but Buhner’s OPS+ of 125 with the Mariners wasn’t a work of fiction. Adding insult to injury, Buhner also tormented his former team on the field, batting .283/.379/.548 in over 400 regular season plate appearances to go along with a line of .366/.422/.537 in three post season series.

Top-10 OPS+ by Yankees in Their Debut Season

Note: Based on a minimum of 50 plate appearances.
Source: Baseball-reference.com

Albeit in only 69 plate appearances, Jesus Montero had the third highest OPS+ among all position players who debuted with the Yankees. That might seem like a bad omen, but he is surrounded on that list by more than a few players whose careers proved to be disappointments. Will Jesus Montero also follow that path, or join (and perhaps top) the list of young players who excelled after being trading by the Yankees? I wonder what Larry David thinks?

Color By Numbers: Late Bloomers

After 13 seasons, Melvin Mora has decided to retire from baseball. The announcement, which was made last week, went largely unnoticed, but that’s not really much of a surprise. After all, most people probably didn’t even realize he was still playing (in 2011, Mora played 42 games for the Arizona Diamondbacks before being released at the end of June).

Never a superstar, Mora did have a very productive career, compiling 26.5 Wins Above Replacement and producing an OPS+ of 105, which isn’t too bad for a player who filled in at seven different positions during his time in the majors. What makes Mora’s career interesting, however, is not how he performed in the majors, but how long it took him to get there.

After eight seasons and over 3,000 plate appearances in the minor leagues, Mora finally got a taste of big league life in 1999. A product of the Houston Astros’ Venezuelan player development machine, Mora never blossomed in that organization, but a strong campaign with the Mets’ Norfolk affiliate that year finally helped earn him a promotion. Although Mora had to be ecstatic about finally getting to play, facing Randy Johnson in his first big league game may have had him rethinking all those years he toiled in the minors.

Distribution of Major League Debut Ages, Since 1901
 
Source: baseball-reference.com

When Mora played in his first game, he was already 27, which, by rookie standards, is rather long in the tooth. Since 1901, only 1,177 non-pitchers have debuted in the majors at that age or older, and just over one-quarter of that total lasted long enough to play a season’s worth of games. Mora defied the odds, however, and stuck around for 13 years.

Among players breaking into the majors at age 27 or older, Mora ranks ninth in terms of cumulative WAR. At the top of the list is Jackie Robinson, whose debut was delayed by baseball’s color barrier, followed by Ichiro Suzuki, who got a late start in the majors because he previously spent nine seasons playing inJapan. Considering the extenuating circumstances pertaining to Robinson and Ichiro, Bob Johnson is more aptly considered the player who made the most of a late start. In 13 seasons following his promotion at the age of 27, Indian Bob posted a cumulative WAR of 53.2 during a career that featured seven All Star appearances. Who knows, had Johnson broken into the big leagues sooner, he could have end up as a Hall of Famer?

Late Bloomers: WAR Leaders Among Players Who Debuted At Age-27 or Older

Source: baseball-reference.com

At the other end of the spectrum is a player like Bob Lillis, who had the misfortune of being a short stop in the Dodgers’ farm system while Pee Wee Reese was going strong. In addition to be being buried on the depth chart, Lillis also had to contend with frequent injures, but, at the age of 28, he finally preserved by making the majors in 1958. Lillis actually had a very strong debut season, batting .391 in 69 at bats, but found himself now taking a back seat to new starting short stop Don Zimmer. After his first season, it was all down hill for Lillis, who ended up with an OPS+ of 55 and WAR of -6.9 over a career that spanned almost 2,500 plate appearances in 10 seasons. Apparently, good things don’t always come to those who wait, but at least Lillis qualified for the pension.

Lillis was lucky to stick around for so long because so many others in a similar situation were only given a fleeting glimpse of life in the majors. Moonlight Graham is probably the most famous case of such a player. At age 27, the right fielder finally got his big break, but it only lasted for 1 1/3 innings as a defensive replacement. Graham went on to become a doctor, and his story became immortalized on page and screen, but so many others had to be content with a page in the baseball encyclopedia (click here for list of players who appeared in one major league game). When you think about, even that’s not so bad, considering the thousands of career minor leaguers who would have given an arm and a leg (and some probably did) to join them.

Melvin Mora could have been one of those long suffering journeyman who never realized his dream. Instead, he is retiring after 13 productive seasons in the majors. Fortunately, Mora had the patience to wait for his chance, but it makes you wonder, how many others forfeited a big league career because theirs ran out?

Color By Numbers: Saving the Best for Last

Is Lou Whitaker a Hall of Famer? The case is very compelling, especially when compared to Hall of Fame contemporary Ryne Sandberg. Unfortunately, consideration of that question came to an abrupt end when an inexplicable lack of support from the BBWAA resulted in his name being dropped from the ballot after his first year of eligibility.

Lou Whitaker vs. Ryne Sandberg, Career Numbers and Five-Year Comparisons (click to enlarge)

Source: baseball-reference.com and fangraphs.com

Unless the Hall of Fame decides to reinstate Whitaker, the only hope for the Tigers’ second baseman will come from the Veteran’s committee. And, that’s probably just as well. In 1980, Ron Santo was dropped from the ballot in his first year of eligibility, and reinstatement did little to help his chances at enshrinement. From 1985 to 1998, the BBWAA continued to pass over Santo, and then the Veterans’ committee upheld the snub for 12 more years until his posthumous selection in November.

With Santo’s pending enshrinement, Whitaker may now be the best player not in the Hall of Fame (excluding those players who have fallen under the cloud of steroid vigilantism). However, my objective isn’t to regurgitate the same argument that has been made so convincingly by many others. After all, considering the case of Santo, there will likely be plenty of time to debate Whitaker’s Hall of Fame credentials. Rather, what interests me most about the Tigers’ second baseman is not the overall value of his career, but how strongly, and quietly, it ended.

In terms of OPS+, Lou Whitaker’s last five seasons were his best. Although other spans yielded a higher cumulative WAR, it should be noted that his last two years were shortened because of the strike that ended the 1994 season and an injury that may have been related to the abrupt beginning to the 1995 season. Regardless, in the last five seasons of his career, he compiled a WAR of 19.6, which ranks as the 24th highest total by any position player since 1901. By removing the Hall of Famers from that list, Whitaker moves all the way up to 13th, and three players (Barry Bonds, Shoeless Joe Jackson, and Mark McGwire) ahead of him would likely have been enshrined if not for off field allegations of impropriety.

Most WAR Compiled in a Position Player’s Final Five Years (click to enlarge)

Source: baseball-reference.com

So, if he was still playing well, why did Whitaker decide to retire? Interestingly, for a player of his stature, there is very little information available to answer that question. Following the 1995 season, the Tigers declined to offer arbitration to Whitaker and long-time double play partner Alan Trammell, so both men filed for free agency. Trammell eventually signed a one-year deal with Detroit, but Whitaker seemed to fade into oblivion. A search of the Google newspaper archive revealed one article in which Whitaker mentions that he would use the offseason to contemplate retirement, but an official announcement was never made.

In 1994, amid the MLBPA strike, Lou Whitaker caused a stir by showing up for a union meeting in a flashy suit and white stretch limo. The media immediately seized upon the image, but Whitaker didn’t back down. “I’m rich. I make money,” Whitaker told the assembled reporters. “I got a Rolls Royce, limo, big house. What’s going to make me look bad?” Because of those statements, Whitaker was portrayed by some as being out of touch, and others cited his attitude as a reason why interest in baseball was in decline. Considering this sentiment, maybe it isn’t such as surprise that Whitaker retired in relative anonymity? And, maybe some of that resentment carried over five years later when Whitaker’s name first appeared on the Hall of Fame ballot?

Was this the lasting image of Whitaker soon after his retirement? (Photo: AP)

Who knows why Whitaker’s Hall of Fame candidacy has gotten so little support. Because he walked away near the top of his game, you’d expect the lasting impression of his career to be more positive, but perhaps the images of that white limo erased some of the memories about his Gold Gloves and Silver Sluggers? Whatever the reason, hopefully the Hall of Fame will reconsider its treatment of Whitaker so the second baseman can add a plaque in Cooperstown to his already impressive list of worldly possessions.

Color By Numbers: Danks, but No Danks (for the Yankees)

Photo: Getty Images

The trade market was supposed to be the Yankees refuge from this year’s class of overpriced, and perhaps overrated, free agents. Brian Cashman has reportedly been kicking the tires on several young pitchers, but, at least at this point, the demands have been too extravagant. One of the names in which the Yankees were believed to have an interest was John Danks, but now even he is no longer eligible for consideration. After weeks of espousing a “rebuilding philosophy”, the White Sox did a semi-about face and signed Danks to a five-year, $65 million extension.

Beyond the disappointment expressed by Yankees’ fans, the Danks extension was greeted by two common reactions. The first was confusion, namely, why are the White Sox handing out lucrative contract extensions when GM Kenny Williams has repeatedly talked about being a seller this offseason? The second reaction was incredulity over the terms, especially when compared to two recent extensions for pitchers with a similar amount of service time (Chad Billingsley and Wandy Rodriguez). However, both of these responses seem to miss a key point. Danks is a uniquely talented young lefty.

At age 26, John Danks is not that much older than some of the prospects over which so many drool. The difference, of course, is the White Sox’ left hander has five full major league seasons under his belt, during which he has compiled a WAR of 19.2. Put in a historical context, only seven other left handers, age-26 or younger, had a higher WAR over their first five seasons, and most on the list that surround him went on to very successful careers (1,769 pitchers qualified for this screen). In other words, not only has Danks been pretty darn good, but the best may be yet to come.

Top-15 Young Southpaws, from 1901*
 
*Noodles Hahn’s career began in 1899, and his statistics before from 1899-1900 are excluded.
Note: Data is from first five seasons of left-handed pitchers age-26 or younger.
Source: baseball-reference.com

Although it should be noted that Danks’ performance has fallen off since his peak 2008 season, his peripherals are strong and, just as important, he is still relatively young. So, if his past performance and future potential are accurately depicted in the chart above, it’s easy to see why the White Sox would be willing to extend him even if in the midst of a rebuilding process. Talented young left handers are a very valuable commodity, and they tend to do very well in free agency. Had the White Sox allowed Danks to hit the open market after this season, there’s a good chance the then 28-year old would have commanded a contract well in excess of the extension he just signed. After all, the White Sox will be paying Danks over the next four years the same amount the Rangers just bid simply for the right to negotiate with Yu Darvish. And, if other teams agree that Danks’ contract is a relative bargain, the White Sox should have no problem trading him should the organization determine that its “retooling” will take longer than expected.

In contrast to my viewpoint, some have suggested that the White Sox were overzealous in their decision to extend Danks because Billingsley and Rodriguez, two pitchers who have been statistically similar, recently signed three-year deals for $35 million and $34 million, respectively. Off the bat, the comparison to Rodriguez fails because the Astros’ lefty was 32 when he signed his extension, or one year older than Danks will be when his new deal expires. Billingsley, however, is a good comparison, but since when does one contract define the market?

As mentioned above, there is every reason to believe Danks would have been a very popular free agent in 2012, which seems much more relevant than what Billingsley accepted last spring. Furthermore, a comparison of the two contracts requires that one look at risk in two ways. In addition to the increased exposure to injury and underperformance that comes from a longer-term deal, teams must also consider the risk of replacement cost. Assuming Billingsley and Danks perform up to expectations, which is the basis for offering an extension in the first place, both pitchers will likely command another lucrative contract when their current one expires. Should that scenario come to fruition, the White Sox will likely be enjoying Danks’ age-31 season at a discount, while the Dodgers are forced to re-extend Billingsley one year earlier (Los Angeles has a $14 million option for 2014). Although a myriad of variables must be considered, many based on conjecture, the possibility of Danks’ longer deal being more cost effective can’t be ignored.

Who knows how seriously the Yankees and White Sox discussed a deal for John Danks? For months, I have been advocating (and hoping) for such an exchange, but now it’s time to move on to another target. Without many attractive options remaining (maybe Gio Gonzalez and Matt Cain), however, the new question becomes just how far to look ahead? Yankees’ fans may not like to hear this, but it’s entirely possible this offseason is simply laying the groundwork for winters to come.

Color By Numbers: Lasting Legacy

When Albert Pujols decided to break his 11-year bond with the St. Louis Cardinals, there was much lament expressed about the perceived gradual decline in one-team, or legacy, players. Upon closer inspection, however, it appears as the practice of playing a long career in only one uniform has never really been that prevalent, which makes this rare breed all the more special.

Legacy Players by Franchise

Note: Based on a minimum of 10 seasons and 4,000 plate appearances with one team for positions players, and 10 seasons for pitchers. Year of retirement is used as basis for enumeration.
Source: Baseball-reference.com

As illustrated by the chart above, the Yankees have had more legacy players than any other team. Beginning with Lou Gehrig and continuing on to current players like Mariano Rivera, Derek Jeter, and Jorge Posada, the Yankees have featured a litany of Hall of Fame players who never suited up for another team. This royal line of all-time greats has not only helped the Bronx Bombers compile one of the most impressive records of success in all of sports, but also created a rich history that has become an integral component of the Yankees’ brand.

Legacy Yankees

Source:Baseball-reference.com

The Yankees have had 19 “franchise players” (which could grow to 22 if the three aforementioned members of the core four retire in pinstripes), including several who are considered to be among the very best players in the history of the game. In comparison, the bottom-15 teams on the legacy chart (including six teams that do not have any) only have 16 such players combined. Despite this stark contrast, many teams do boast at least one prominent franchise player. Lists containing each team’s most tenured legacy position player and pitcher are presented below.

Leading Legacy Position Players and Pitchers, by Franchise

Note: Listed players lead their respective franchises in games played with only one team. * Denotes a Hall of Famer.
Source:Baseball-reference.com

Not surprisingly, many of the players included on the lists above are in the Hall of Fame. Among the position players, 60% are enshrined in Cooperstown, while 35% of the pitchers (and 55% of the starters) have a plaque hanging in the Hall’s gallery. Although most of the players, even those not in the Hall, are household names, there are also some who are rather obscure. None, however, were as futile as Pete Suder, who not only ranks as the Athletics’ all-time games leader among legacy players, but managed to post a negative WAR despite being afforded such longevity.

Stan Musial, Carl Yastrzemski, and Cal Ripken all made much better use of their opportunities than Suder. That trio comprises a select fraternity of players who appeared in over 3,000 games, all for one team. Meanwhile, Walter Johnson’s 935 games with the Senators easily outdistances all other legacy pitchers. However, it should be noted that when Mariano Rivera retires (assuming he ever does), his 1,042 games (and counting) would easily surpass the Big Train, although Johnson would retain the title among starters.

Potential Legacy Players

Note: Includes those players who meet the criteria outlined in the exhibits above, but who have not yet retired.
Source: Baseball-reference.com

Other current players creeping up on the list of legacy leaders include Chipper Jones, who could become the first Braves’ position player to spend at least 10 seasons and 4,000 plate appearances with the franchise. Similarly, Carlos Zambrano, Aaron Cook, Michael Young and Todd Helton could also become their franchise’s first legacy player/player, assuming they don’t sign with another team before retiring. Finally, Derek Jeter and Ichiro Suzuki are also in line to join the list by overtaking Mantle and Edgar Martinez, respectively, for their team’s leadership position.

How important is it for a player to spend his entire career with one team? Does it matter that Ron Santo, the quintessential Cub, played his final season for the cross-town White Sox? Or that Willie Mays and Hank Aaron capped off their historic careers by returning to the cities where they started, but with a different franchise? How many people even know Yogi Berra had nine plate appearances with the Mets, Christy Mathewson pitched his last game with the Reds, and Ty Cobb passed the 4,000-hit plateau wearing the uniform of the Philadelphia Athletics? Granted, in situations like Albert Pujols’, when a player splits a long career with two different teams, there can be a conflict of loyalties, but for the most part, staying true to only one team is little more than trivia bookkeeping. It may be fun to discuss and romanticize, but lasting legacies are created by the impact a player makes in a uniform, not how long he wears it.

Color By Numbers: A King And A Prince

So far, the Hot Stove has resembled more of a cold shoulder. Despite some very high profile names, the early transactions this offseason have mostly involved a myriad of middle infielders and back-up catchers. Although the wheeling and dealing should ratchet up a notch during next week’s Winter Meeting, the relative silence to this point has been a little surprising.

Among all the free agents available on the market, Albert Pujols is the cream of the crop. However, with the exception of a recent report about interest from the Cubs, there hasn’t been much talk about where the three-time MVP will wind up. In fact, there was more early speculation surrounding Pujols last year, when he and the Cardinals flirted with a contract extension.

There are two factors complicating Pujols first crack at free agency. The first one is the major market teams either already have a big ticket first baseman (Yankees and Red Sox) or are currently embroiled in a financial morass (Dodgers and Mets). The second factor is the free agency of fellow first baseman Prince Fielder, who is not only four years the junior of Pujols, but, in 2011, actually had a better season with the bat than the Cardinals’ stalwart.

Top-10 Career OPS+ Leaders

Note: Minimum 3,000 plate appearance
Source: Baseball-reference.com

Despite some of the concerns about Pujols emerging mortality, it’s worth noting that while his OPS+ of 150 was the lowest of his career, that level of production was still eighth best in the National League (and higher than Fielder’s career rate of 143). That some would consider his 2011 campaign worthy of a red flag indicates how historically spectacular Pujols’ career has been.

Most Seasons as OPS+ League Leader

*Was the leader in both the American and National Leagues.
Source: Baseball-reference.com

Only seven players with at least 3,000 major league plate appearances can boast an OPS+ higher than Albert Pujols’ career rate of 170, and all of the names ahead of him qualify for the inner circle of baseball’s immortals. On a per season basis, Pujols has led his league in OPS+ on four different occasions (including three straight seasons from 2008 to 2010), an accomplishment bettered by only 12 other players.

Intuitively, most people have regarded Pujols as the best hitter, if not best player, in the game, at least up until last year. Instead of awarding that title subjectively, however, I thought it might be interesting, and fun, to pass the torch using statistics. For this purpose, OPS+ seemed like the best metric to use. Although there are other statistics like wOBA that better measure overall offensive performance, OPS+ still has the advantage of being more well known, easier to compute, and adjusted for ballpark and era. Also, instead of taking one-year snapshots, sustained periods of excellence seemed more appropriate. Is 10 years the right barometer? That can be debated, but if it’s good enough for the Hall of Fame, it’s good enough for me.

“Diamond Kings”: Succession of OPS+ Leaders Over 10-Year Periods

Note: Minimum 5,000 plate appearances for each 10-year period.
Source: Baseball-reference.com

Based on the chart above, Pujols has been a Diamond King for the past four seasons, joining a royal lineage that began with Nap Lajoie and almost exclusively includes undisputable legends. A quick scan of the list reveals all the names you’d expect to be included: Honus Wagner, Ty Cobb, Rogers Hornsby, Babe Ruth, Lou Gehrig, and so on. However, there are some surprises. Bill Nicholson is probably a name not well known even among many diehard fans, but for three 10-year periods, he ranked as the top hitter in the game. Of course, his era of dominance happened to coincide with World War II, which, at the risk of disparaging his accomplishment, probably explains his inclusion. The only other ranking member of the list who isn’t in the Hall of Fame (excluding those not yet eligible) is Dick Allen, who was the top dog for four 10-year periods. Unlike with Nicholson, however, there is no extenuating circumstance. Allen’s career OPS+ of 156 ranks among the 20 best all-time, which makes his Cooperstown snub one of the most unfortunate.

Two other unlikely names who can lay claim to an OPS+ crown also happen to be former Yankees. Although no one would dispute that Wade Boggs and Rickey Henderson were all-time greats, their presence atop a list that disproportionately favors sluggers is somewhat surprising. Nonetheless, it does help to illustrate how complete their offensive games really were. In many ways, Henderson and Boggs are two of the most underrated Hall of Famers, even though most people hold them in very high regard.

Finally, the biggest surprise from the list above is one who is not included: Ted Williams. If the threshold considered had been 4,000 plate appearances, Teddy Ballgame would have been front and center for most of his career. However, because of his two stints as a fighter pilot in the Marine Corps, the Splendid Splinter never qualified. I like to think his exception proves the rule.

Pujols’ status as one of the greatest hitters in baseball history isn’t exactly a secret, but it’s still impressive to consider his body of work within the context of the all-time greats. Entering his age-32 season, the future first ballot Hall of Famer may no longer be in his prime, but if continues to keep the same company he has enjoyed for his entire career, there’s no reason to think his twilight will be a flicker.

Where will Pujols end his career? In St. Louis? How about Chicago? Pinstripes might look nice. Regardless, Prince Albert remains the King, and my bet is he isn’t yet ready to submit to a succession.

Color By Numbers: It’s A Major Award

The offseason awards season hasn’t been very kind to the Yankees so far. Ivan Nova and C.C. Sabathia, the team’s respective candidates for the Rookie of the Year and Cy Young, both finished a distant fourth in the voting, but at least that was one slot ahead of manager Joe Girardi, who placed fifth in Manager of the Year balloting. With only MVP left to consider, and Curtis Granderson considered somewhat of a long shot, chances are the Yankees will wind up empty handed.

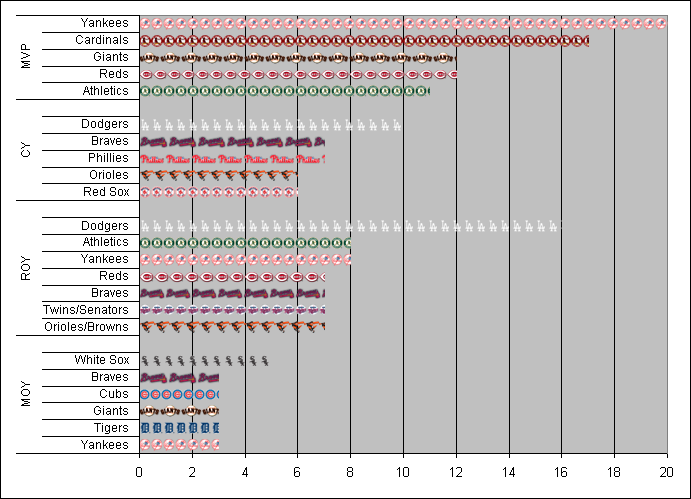
Yankees’ Historical Award Totals

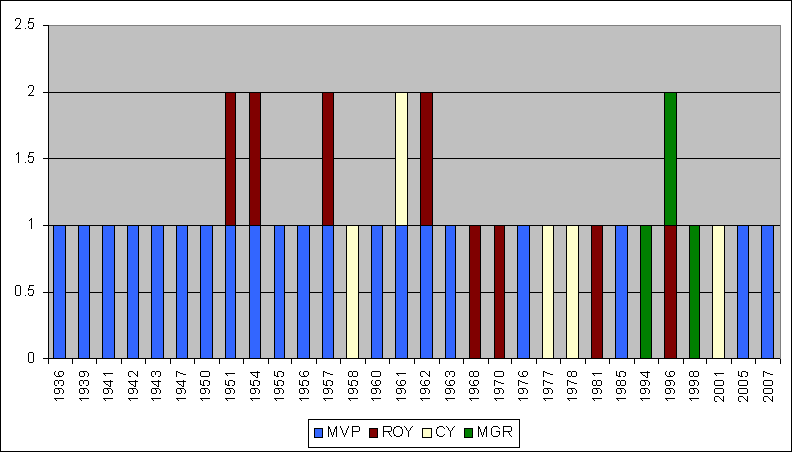
Note: MVP first awarded in 1931; RoY in 1947 (one award until 1949); CY in 1956 (one award until 1967); MoY in 1983
Source: mlb.com

To go along with all of the franchise’s other accolades, the Yankees have had more MVPs than any other team, and also rank among the leaders for all of the other major awards. However, since 1985, only seven awards have been handed out to the pinstripes, and three of those were to the manager. Many Bronx Bomber fans probably view this as evidence of bias against the team within the ranks of the BBWAA, but it might also speak to how well rounded the Yankees have been over the last two decades.

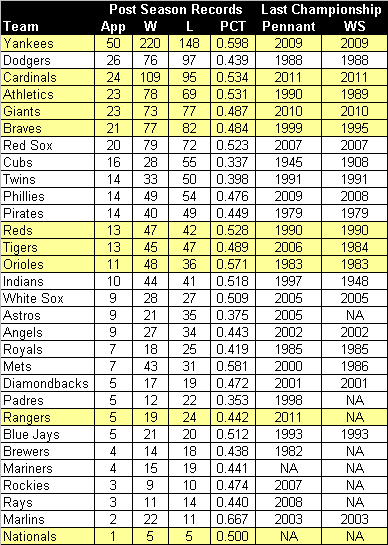
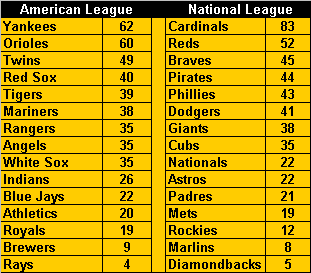
Top Major Award Winners, by Franchise

Source: mlb.com

Since the award was first bestowed upon Jackie Robinson in 1947, the Rookie of the Year has become synonymous with the Dodgers. With four honorees while in Brooklyn and 12 while in Los Angeles, the Dodgers have consistently churned out talented youngsters. The franchise’s 16 Rookie of the Year trophies not only equal the combined total of the next two teams, but also include two stretches of at least four consecutive winners, each of which alone would sum to more awards than the individual totals for 18 other teams. What makes the Dodgers’ RoY dominance even more impressive is the award requires a new winner every season, so having one or two great players doesn’t account for the lion’s share of a team’s total.

Along with the Athletics, the Yankees lead the American League with eight Rookie of the Year winners, but Derek Jeter has been the franchise’s only honoree since Dave Righetti won the award in 1981. Jesus Montero has a good chance to break that drought in 2012, assuming the Yankees are able to find him a position. In the almost 40 years since the DH was created, only the Royals’ Bob Hammelin, who bested Manny Ramirez, has won the Rookie of Year by taking most his at bats as a designated hitter. At this point, that seems to be the Yankees’ plan for Montero, so in order for him to win the honor next season, he’ll have to buck that historical trend.

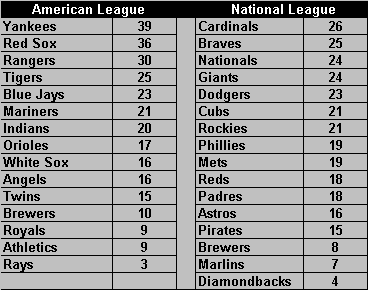
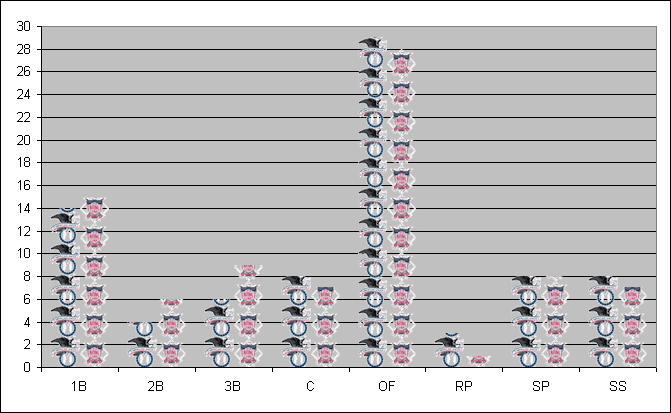
Rookie of the Year Winners, by Position and League

Note: Players considered only at the position they played the most.
Source: mlb.com

Manager of the Year is perhaps the most nebulous of the four major awards. Apparently, a successful manager is not only judged by the performance of his team, but by the lack of payroll allotted to it. That’s unfortunate for Joe Girardi now, but, when he became the only MoY to win the award with a losing record while with the Marlins in 2006, it was Willie Randolph who was left to lament.

Although the MoY is the most recent of the major awards, it rivals the RoY in terms of broad distribution. Only the Mets and Brewers have never had a manager win the honor (the Diamondbacks are the only team without a RoY), meaning more teams have had MoY designees than the Cy Young and MVP (25 teams each), both of which have been around much longer.

This year, both MoY selections made a bit of history. In the A.L.,  Joe Maddon became the 12th manager to win the award at least twice, while in the N.L., Kirk Gibson joined an even more select fraternity. Along with his 1988 MVP, Gibson’s MoY award makes him only the four person to win both trophies, joining Joe Torre, Frank Robinson and Don Baylor.

Multiple Manager of the Year Winners

Source: mlb.com

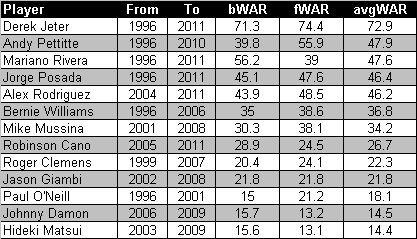
To no one’s surprise, Justin Verlander was unanimously selected as Cy Young in the American League, making him only the 14th different pitcher (and 21st selection) to be so honored.  Verlander was also the first Tigers’ starting pitcher to win the award since Denny McLain won it consecutively in 1968 and 1969. Among the pitchers Verlander beat out for the award was C.C. Sabathia, who finished a distant fourth (the big lefty has finished no lower than fourth in the balloting during all three of his seasons in pinstripes). Although Sabathia didn’t seem to get much serious consideration for the top of the ballot, it’s worth noting that fangraph’s version of WAR actually had the Yankees’ ace leading the American League.

In the National League, Clayton Kershaw was named Cy Young, becoming the youngest pitcher to win the award since a 20-year old Dwight Gooden in 1985 and adding to the Dodgers’ major league leading total of 10 honorees. In order to win the award, Kershaw had to beat out reigning Cy Young Roy Halladay, who led the National League in both versions of WAR. Perhaps the electorate has grown a little weary of honoring Halladay, but even so, it’s hard to argue with Kershaw credentials.

Unanimous Cy Young Award Winners
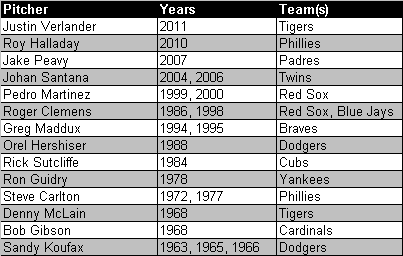
Source: mlb.com

This year’s MVP vote in the American League could be among the closest ever. In addition to prominent candidates from most of the contending teams, Jose Bautista had another phenomenal season, so there is no lack of deserving winners. However, most of the attention has revolved around whether Verlander could, or should, win both the MVP and the Cy Young.

In the 55 years of concurrent history between the two awards, nine pitchers have been named both Cy Young and MVP, and of that total, three of the last four have been relief pitches. So, needless to say, the BBWAA has been at least a little reluctant to give the MVP to a player who takes the field less than 40 times per season. But, was Verlander’s 2011 campaign strong enough to mitigate that reticence?

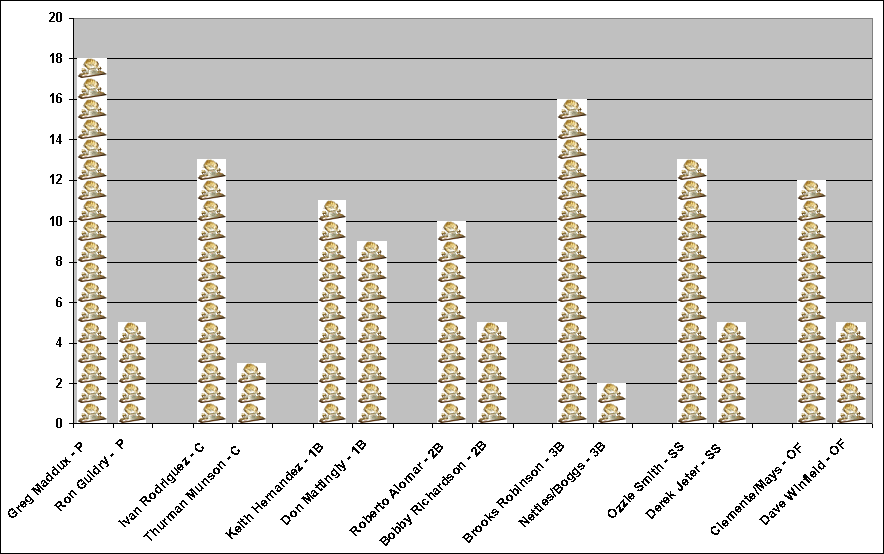
Players Who Have Won Two Major Awards in One Season
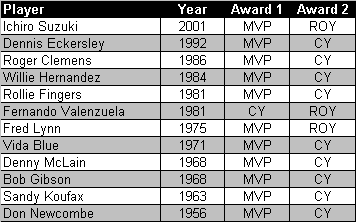
Source: mlb.com        

Regardless of where you come down on the Pitcher-as-MVP debate, Verlander stands on the verge of an even more select accomplishment. Should the Tigers’ right hander add to his trophy case next week, he’ll join Don Newcombe as the only player to be honored as a RoY, Cy Young, and MVP. The Newk, who was voted the top rookie in both leagues for 1949, was named MVP and Cy Young five seasons later in 1956 (he missed three years to his service in the Korean War). If Verlander is similarly honored, he will have taken the same path to join Newcombe.

In the National League, the MVP race seems to be a two horse race, with Ryan Braun having the edge over Matt Kemp because of the relative success of his team. If the two players do finish 1-2, it would be appropriate for several reasons, not the least of which is both men recently signed mega-contract extensions that will pay them over $20 million per season into the next decade. Needless to say, the Brewers and Dodgers will be hoping this isn’t the last time Braun and Kemp find themselves atop the MVP balloting.

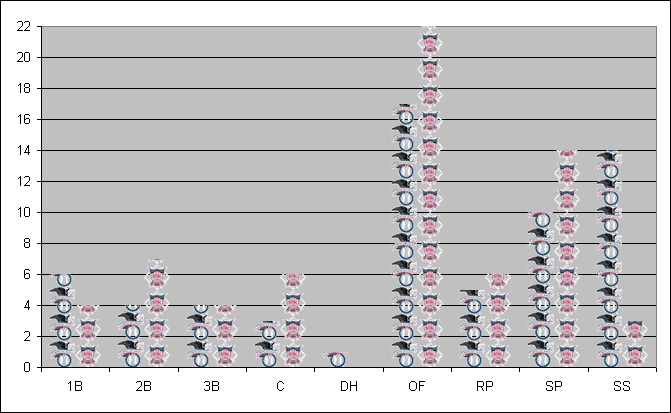
MVP Winners, by Position and League


Note: Players considered only at the position they played the most.
Source: mlb.com

The baseball awards season not only provides a cap on the current year, but also the perfect segue into the Hot Stove. Before too long, fans will be digesting their team’s winter acquisitions and projecting which players are poised for a break-out season. Among that group could be next year’s major award winners, but those future Cy Youngs, RoYs and MVPs will have to wait. The spotlight still belongs to this year’s Boys of November.

Color By Numbers: Hip Hip Jorge

Jorge Posada’s Yankees career has come to an end, at least that’s what he seems to think. Considering Brian Cashman has not even reached out to discuss a reduced role with his long-time catcher, chances are Posada’s hunch is probably right. There’s always a possibility, albeit slim, that the Yankees could decide Posada still fits into their plans for 2012, but if this really is the end of his time in pinstripes, we can finally take a look back over his long career and truly appreciate just how much he has meant to the organization.

Average WAR During the Current Yankees’ Dynasty, 1996-2011

Note: avgWAR = (bWAR + fWAR)/2
Source: baseball-reference.com and fangraphs.com

Since 1996, when the current Yankees’ dynasty was born, only Derek Jeter, Andy Pettitte and Mariano Rivera contributed more to the team than Posada, at least in terms of average WAR. Of course, you really don’t need a sophisticated sabermetric to illustrate how important Posada was to the franchise’s incredible success over the span of his career. He really was a core member of the Yankees. That wasn’t just a clever marketing slogan.

The magnitude of Posada’s contribution to the Yankees is impressive even beyond the context of the era in which he played. Again using average WAR as a barometer, only 10 position players have contributed more to the pinstripes, and, needless to say, the company is rather select. By just about any measure, it isn’t a stretch to say that Jorge Posada is one of the greatest Yankees to ever play the game, and many of the players worthy of that distinction also happen to be in the Hall of Fame.

Yankees Top-15 Position Players, Ranked by Average WAR

Note: avgWAR = (bWAR + fWAR)/2
Source: baseball-reference.com and fangraphs.com

Although some might dispute the notion of Posada as Cooperstown worthy, his credentials are compelling. Unfortunately for the Yankees’ backstop, his career happened to coincide with arguably the greatest offensive (Mike Piazza) and defensive (Ivan Rodriguez) catchers to ever play the game, so it’s easy to see why he is sometimes overlooked when making Hall-worthy assessments. Despite these formidable contemporaries, however, Posada’s statistical record still stands out.

Comparing Catchers, 1990-2010


Note: Players with at least 1,000 games, two-thirds of which were as a catcher.
Source: Baseball-reference.com and fangraphs.com

During the 20-year period from 1990 to 2010, Posada’s OPS+ of 123 ranks second only to Piazza’s 142 (among players with at least 1,000 games, two-thirds of which were as a catcher). The same is true for his wRC+ and wOBA. Based on more traditional stats, Posada also distinguished himself during the period, ranking tied for first in on base percentage and third in home runs and RBIs. As a result, Posada won five silver sluggers behind the plate, the fourth highest total amassed at the position. Although some catchers, such as Joe Mauer, have had better rates over a shorter horizon, Posada’s longevity is also a feather in his cap. In the 20-year span under consideration, only four others have started more games behind the plate, which is remarkable considering how slowly the Yankees eased him into the starting role.

Jorge Posada vs. Hall of Fame Catchers and Likely Inductees

Note: Likely inductees include Mike Piazza and Ivan Rodriguez.
Source: Baseball-reference.com and fangraphs.com

There are currently 12 primary catchers elected to the Hall of Fame, making it the most underrepresented position on the diamond. However, even despite this very select company, Posada’s career totals still figure prominently among catchers already enshrined or almost certain to be. In the chart below, Posada’s relative rankings in several offensive categories are provided. Although a rudimentary analysis, it shows that Posada can stand toe-to-toe as a hitter with every other Hall of Fame backstop but Piazza.

Posada’s Ranking Among Hall of Fame Catchers and Likely Inductees

Note: Likely inductees include Mike Piazza and Ivan Rodriguez.
Source: Baseball-reference.com and fangraphs.com

As a hitter, Jorge Posada’s Hall of Fame credentials seem undeniable, so the deciding factor could be his work behind the plate. Defensive metrics are relatively unreliable in general, but for catchers, they are severely limited. For that reason, it’s likely that Hall of Fame voters will rely on reputation. Because of how rapidly his catching skills declined at the end of his career, that might seem like a liability for Posada, but during his prime, the backstop was often regarded as being an above average defender. If that’s the prevailing sentiment when Posada’s name comes finally appears on the ballot, his chances of being enshrined would be greatly bolstered.

“I see vintage Jorge Posada, everything we expect. He’s one of the best catchers in baseball and he has been. He’s an offensive and defensive catcher. This is what I expect, this is what he is and this is what he’s been. This guy is going to go down as one of the famous Yankee catchers, along with Yogi Berra, Bill Dickey, Elston Howard and Thurman Munson.” – Brian Cashman, quoted in the New York Daily News, August 8, 2006

How will Jorge Posada be remembered? Despite often being overlooked on a team chock full of talent, Posada’s contribution to the Yankees’ dynasty is undeniable. He is more than deserving of all the accolades usually bestowed upon a Yankees’ legend. His number 20 should never be worn again, and his plaque for Monument Park should soon be minted, but perhaps the most meaningful honor is the special place he occupies in the memories of an entire generation of Yankees’ fan. They won’t soon forget how great Posada really was. Hopefully, the Hall of Fame voters will remember too.

Color By Numbers: Silver and Gold

November is trophy season in major league baseball. The most anticipated awards, like the MVP and Cy Young, come later in the month, but for fans already suffering from withdrawal, the most immediate baseball fix comes in the form of silver and gold. Although the Gold Glove and Silver Slugger aren’t taken that seriously (after all, the two awards are basically a marketing gimmick for Rawlings and Hillerich & Bradsby, respectively), the selections, which this year were announced live on ESPN and the MLB Network, still generate considerable reaction. Unfortunately, particularly in the case of the Gold Glove, most of it seems to be negative.

This year, the Gold Glove selections were not as controversial (mostly thanks to Derek Jeter not winning one). In fact, five of the well respected Fielding Bible Award winners were also awarded with a Gold Glove. However, there were some glaring omissions, the most obvious being Yankees’ left fielder Brett Gardner. By just about every measure, Gardner was not only the best left fielder in the game, but he also ranked among the best outfielders. According to the Field Bible, the Yankees’ speedster tied centerfielder Austin Jackson, who was also denied a Gold Glove, for the most defensive runs saved at 22. That’s an extraordinary total for the center of the diamond, but for a corner position, it’s off the charts. Gardner also topped major league outfielders with a UZR/150 of 29.5, almost doubling the total of Jacoby Ellsbury, who finished a distant second among qualified candidates. Although UZR is a much less reliable metric, the extent to which Gardner led all others was significant. Unfortunately for the Yankees’ left fielder, the Gold Glove voters weren’t that impressed.

The Yankees had two other Gold Glove candidates make it to the “final three” (a new feature of the award) at each position, but Robinson Cano and Mark Teixeira were bested by their Red Sox counterparts. Unlike Gardner’s snub, however, the omission of Cano and Teixeira were well within reason. As a result, one year after tying a franchise record with three Gold Gloves, the Yankees were shutout for only the fifth time since 1982. Although it’s probably no consolation to Gardner, what the Yankees missed out in gold, they made up for in silver.  Both Cano and Curtis Granderson were among the A.L.’s recipients of the Silver Slugger, which honors the best offensive player at each position.

Silver and Gold: Yankees’ Award Winners, Total by Year

Source: mlb.com

Since the Gold Glove was first awarded in 1957, the Yankees have had the second most honorees, behind only the St. Louis Cardinals, who enjoy a comfortable lead over the field with an impressive 83 trophies. At the other end of the spectrum is the Milwaukee Brewers, which makes the team’s traditional ball-in-glove logo somewhat ironic. Since joining the majors as the Seattle Pilots in 1969, the Brewers have had only nine Gold Glove winners, all coming while the franchise was in the American League.

Most Gold Glove Awards, Sorted by League

Source: mlb.com

For perspective, 16 individual players won more Gold Gloves than the entire Brewers’ franchise, including Greg Maddux, who won twice as many. No other player in history has been honored more often than the future Hall of Famer pitcher, who, in addition to racking up over 300 wins, managed to take home 18 Gold Gloves. Among position players, the most gilded glove belonged to Brooks Robinson, who won 16 at third base. The most decorated Yankees player was Don Mattingly. The Captain won nine Gold Gloves at first base during his time in pinstripes, almost doubling the franchise’s next highest total of five, which is shared by Ron Guidry, Derek Jeter, Bobby Richardson and Dave Winfield.

Most Gold Glove Awards by Position, Yankees and All-Time

Source: mlb.com

The Silver Slugger is usually overshadowed by the Gold Glove, but in recent years has started to gain more exposure, including a dedicated announcement show that aired on the MLB Network. Unlike its defensive counterpart, the Silver Slugger involves more than just subjective peer review. Rather, it is based on a combination of statistics as well as the general impressions of managers and coaches. Because of this more balanced approach, the Silver Slugger selections are seldom as controversial. Then again, part of the reason for that may be the relative indifference expressed toward the award.

Even if the Silver Slugger doesn’t carry much cachet, it’s still an honor to be named the best offensive player at a particular position. Since it was given out in 1980, the Yankees have had 39 players deemed worthy of that distinction, more than any other team. Meanwhile, among teams in existence during the entire tenure of the award, the Athletics and Royals ranks dead last with only nine.

Most Silver Sluggers, Sorted by League

Source: baseball-almanac.com

Barry Bonds holds a number of high profile records, so it shouldn’t come as a surprise that he is also the owner of the most Silver Sluggers with 12. Not too far behind are Mike Piazza and Alex Rodriguez, who each have 10. However, Arod has the further distinction of winning his at third base (3) and shortstop (7), making him the only player to win multiple awards at two different defensive positions. In addition to Rodriguez, 11 other players have won at least one Silver Slugger at two defensive positions (not including DH and with no differentiation for the outfield), including Albert Pujols and Miguel Cabrera, who are the only players to be honored at three places on the diamond.

Most Silver Slugger Awards by Position, Yankees and All-Time

Source: baseball-almanac.com

Even though many baseball fans claim not to care about the Gold Glove and Silver Slugger, both awards have endured for a significant period and, by doing so, become a part of the game’s historical record. Despite this, some will probably still accuse me of digging too deeply into a mundane topic, or mining too hard for content in the off season. That’s probably true, but it doesn’t mean a review of baseball’s metallurgical record is completely without merit. For example, if someone can answer how the 1985 Yankees managed to win seven combined Gold Gloves and Silver Sluggers without a winning the division, it will have all been worthwhile.

Color by Numbers: World Series MVPs

For the first time in almost 10 years, the World Series will come down to a game seven. It remains to be seen who will get the big hit or make the big pitch in this winner-take-all scenario, but by the end of the game, new heroes will have emerged, and one of them will be named the World Series MVP.

Had the series ended in six games, the Rangers’ Mike Napoli, whom no one seemed to want this off season, was an almost surefire bet to win the MVP. In fact, even if he is unable to play in game seven, the Rangers’ catcher would still be a near lock to win the award if Texas can pull out a victory. Should the Cardinals win, however, the likely MVP is not as clear. With three hits and three RBIs in game six, including a game tying single with two outs in the 10th inning, Lance Berkman has thrown his hat into the ring. Similarly, David Freese, whose WPA of .953 easily became the highest total in a World Series game, has emerged as a strong MVP candidate. In addition, Allen Craig and Albert Pujols, who have each had memorable moments in the series, could earn the hardware with a big contribution in game seven. Even Chris Carpenter could sneak into the mix if he can match his performance in the final game of the NLDS. In other words, the outcome of the MVP race is in just as much doubt as the game itself.

World Series MVPs by Position (and last recipient)

Note: Players considered at the position where they played the most innings.
Source: Baseball-reference.com

Without a crystal ball, we can’t be sure who will be handed the World Series MVP during tomorrow’s postgame celebration, but at least we can take a look back at those who have won it in the past. In total, there have been 58 honorees since the award was first instituted in 1955. Not surprisingly, the Yankees, at 12, have had the most players named MVP in the Fall Classic, including the only player (Bobby Richardson in 1960) to win the award despite being on the losing team.

Starting pitchers have won 23 World Series MVPs, by far the most of any position. Cumulatively, however, more hitters have been honored. Of the 31 offensive players to be named MVP, third basemen have taken home the most hardware, followed by catchers and shortstops. On the other end of the spectrum, left field and second baseman have almost been shutout, as each position has only featured one honoree.

In terms of batting order, the third and fifth slots have each had six recipients, while, somewhat surprisingly, the seventh and eighth spots have garnered just as many awards as cleanup. Should Mike Napoli win it this year, he would become the fifth seventh place hitter to win the MVP, just one year after Edgar Renteria, who batted eighth, won the trophy for the Giants. At least one player from each slot in the batting order has been named MVP, so come October, just about anyone is capable of being a hero.

World Series MVPs by Batting Order (and last recipient)

Note: Players considered at the lineup slot where they had the most plate appearances. Ninth slot excludes pitchers.
Source: Stats LLC c/o Wall Street Journal

The MVP award isn’t really about positions on the field or slots in the batting order. It is about individuals who rise to the occasion when the games matter most. Normally, when we think about such players, the very best superstars in the game come to mind. And, sure enough, the list of World Series MVPs includes many of these immortal players. From Sandy Koufax, who recorded the highest regular season WAR among all MVPs (10.8 in 1963), to Frank Robinson (8.8 oWAR in 1966) and Mike Schmidt (7.6 oWAR IN 1980), some of the biggest stars in baseball history have shined just as brightly during the Fall Classic.

The World Series MVP has been an All Star 32 times, an MVP five times (Koufax, Robinson, Jackson, Stargell and Schmidt) and Cy Young on seven occasions (Turley, Ford, Koufax (2), Saberhagen, Hershiser and R. Johnson). However, there have been several World Series MVPs who had very little success during the regular season. The most improbable of these was the aforementioned Richardson, who, despite having a negative oWAR and OPS+ of 68, managed to knock in 12 runs, almost half his regular season total, in the 1960 World Series. Bucky Dent, another Yankees’ middle infielder, was also a surprise MVP when he carried the momentum of his three-run homer in the one-game playoff at Fenway Park into the 1978 World Series. In that series, Dent hit .417 with seven RBIs, earning the most valuable player award over Mr. October (2HR, 8RBI, 1.196 OPS).

World Series MVPs by Regular Season WAR*

*Offensive WAR used for batters.
Source: Baseball-reference.com

Among non-Yankees, Renteria (0.6 oWAR), Rick Dempsey (0.6 oWAR in 1983), and Steve Yeager (0.1 oWAR in 1981) rank among the least likely position players to win the MVP in the World Series. The unlikelihood of these players winning the award was summed up best by Dempsey, who while discussing his accomplishment famously joked about his regret over not negotiating a bonus clause into his contract. “Given the odds against that happening, they would’ve given it to me,” Dempsey told reported after the Orioles’ World Series victory.  “I’d have asked for $200,000, they would have said, ‘Here, take $400,000.’”

The average regular season WAR of pitchers who have won the World Series MVP is one full win higher than their position player counterparts, but there have still been more than a few improbable honorees. Johnny Podres, the very first MVP in the Fall Classic, was just a 22-year old kid with little success in the majors when the Dodgers took on the rival Yankees in the 1955 World Series. So, needless to say, no one was expecting him to finally make the difference in Dem Bums’ quixotic attempt to beat the mighty Bronx Bombers. However, that’s exactly what the left hander did by winning two complete games. Thanks to Podres, the Dodgers were finally able to enjoy victory instead of being forced to “wait ‘til next year”.

For 30 years, Podres was the youngest player to win the World Series MVP, but in 1985, a 21-year old right hander claimed the mantle from him. That season, Brett Saberhagen took the American League by storm, winning 20 games and earning the Cy Young award in only his second season. The ALCS wasn’t as kind to the young pitcher, however, as the Blue Jays knocked him out before the fifth inning in both of his starts. Saberhagen rebounded from that disappointment in the World Series, surrendering only one run in two complete game victories to give the Royals their first and only championship to date.

World Series MVPs by Age

*Offensive WAR used for batters.
Source: Baseball-reference.com

So, as the Rangers and Cardinals head into game seven, round up all the usual suspects. One of them is bound to have a big game. At the same time, however, don’t take your eyes off the role players. As the Rangers, and the Brewers before them, have learned, guys like David Freese can be just as dangerous as Albert Pujols, especially when you are one strike away from winning the World Series.

Color By Numbers: There’s No Place Like Home

One of the most controversial things about the World Series is how home field is determined. Unlike other sports, which either use a neutral field or assign home field to the team with the better regular season record, baseball has decided to link the extra home game in the Fall Classic to the outcome of the Midseason Classic. To some, this connection borders on the absurd, but does home field in the World Series really matter?

Several studies have been done on this topic, and most, like this one, have concluded that there really is no advantage to home field in the baseball postseason. However, analyses that focus on series outcomes, instead of individual games, can be misleading. After all, if the home team wins four of the first games in a best of seven series, the team without the advantage would emerge victorious.

Root for the Home Team? Postseason, Regular Season Records at Home

* Since 1919
Source: Baseball-reference.com

Not including last night’s opener in St. Louis, the home team has won 339 of 614 World Series games, or just over 55%. In essence, during the Fall Classic, there is a 17-win difference between home and road teams (based on a 162-game season), so where each game is played seems to have a significant impact. Although some might question the sample size, the 55% win rate for the home team is not only in line with the percentage in the entire post season, but also closely mirrors the outcomes of every regular season game played since 1919.

The team with home field advantage has won the World Series 58 of 102 times (excluding four World Series that featured eight games), a percentage that is in line with the 55% per game win rate cited above. However, because the “road team” in a seven game series is the first to host three games (thanks to the 2-3-2 format), conventional wisdom has suggested that only in a deciding game seven does the ballpark really matter. And yet, a closer look into the actual results tells a different story.

Home Team Record by World Series Game

Source: Baseball-reference.com

There have been 35 winner-take-all game 7s in World Series play, and the road team has won 18 of them. However, actually getting to the seventh game hasn’t been as easy. In games 1, 2, and 6, the home team not only enjoys a significant advantage, but it is also much greater than the one exhibited in games 3, 4, and 5. Apparently, in order for a team without home field advantage to win the Fall Classic, survival is the key (over 45% of World Series won by teams without home field came down to a winner-take-all game). Then again, the last eight game 7s have all been won by the home team (the 1979 Pirates are the last team to win a double elimination game as a visitor),  so even this one refuge for the road team has been taken away.

Because baseball has used a random method of assigning home field for most of its history, it’s hard to explain why there hasn’t been much of an advantage in the middle three games. Perhaps it’s because those games are more likely to feature second tier starters, which mitigates the advantage? Or, maybe the momentum (which for many sabermetricians is a dreaded concept) of early success carries over to the rest of the series? Regardless of the reason, it seems clear that home field advantage not only impacts the number of games a team has in its own ballpark, but how well they perform in front of the hometown crowd.

Home Team Performance in the World Series, by Decade

Note: Eight game series excluded from calculations.
Source: Baseball-reference.com

A breakdown of World Series results by decade reveals significant fluctuations in the impact of home field advantage, which shouldn’t be surprising when you consider the random manner in which it was determined for almost 100 years. Nonetheless, it’s interesting to note that in the 1940s, when the road team won 53% of all Fall Classic Series games, the team with home field advantage won 90% of the World Series. Then, in the 1950s, the opposite happened. That decade, home teams won 61% of all games, but 70% of the World Series were won by the team starting off on the road.

Although there seem to be so many conflicts and counterintuitive aspects of the data, we can definitively say that home field advantage in the World Series matters. After all, 23 of the last 30 Fall Classics have been won by the team that hosted game one. Of course, that brings us back to the question of whether such a meaningful reward should be granted based on the outcome of the All Star Game. I would argue yes, but it’s easy to see why others might disagree. Regardless of one’s position, however, what seems clear is that fans, players, and teams should probably starting take the midseason classic a little more seriously because, nowadays, it really does count.

Yogi, by Yogi

Color by Numbers: Winner Take All

Sometimes, drama in baseball can be drowned out by the sea of 162 games. Even in the postseason, urgency can be limited by the margin for error built into a multi-game series. However, once it becomes winner-take-all, all bets are off and the tension really mounts.

Major League Baseball has gone years without a single sudden death game, but now it has already been blessed with three, a total that matches the last four seasons combined. Although the games that force a “double elimination” scenario can sometimes be more memorable (see Don Denkinger, Billy Buckner, and Steve Bartman), it is usually when both teams have their backs against the wall that legends are born in October.

Sudden Death Games by Season, Since the Advent of Divisional Play

Source: Baseball-reference.com

Perhaps the best example of a player going from relative obscurity to immorality is Francisco Cabrera, who, despite having fewer than 400 plate appearances in his career, earned a place in baseball lore by authoring one of the most dramatic moments in the sport’s history. Cabrera’s two-run single, which vaulted the Braves over the Pirates in game 7 of the 1992 NLCS, still reverberates to this day, and it’s easy to understand why. Cabrera’s game winning hit ranks as the highest WPA by any player in a sudden death postseason game, not to mention a single at bat (out of 1,934 games and 5,708 PAs). In other words, there has never been a more significant postseason turning point (which some might argue also reversed the course of the Pirates’ franchise).

Top-10 Sudden Death Games by a Batter, Ranked by WPA

Source: Baseball-reference.com

One year earlier, the Braves were on the other end of a historic, winner-take-all performance. Entering game 7 of the 1991 World Series, everyone expected a pitchers’ duel, but no one could have anticipated that length to which Jack Morris would go, both literally and figuratively. Morris matched zeros with John Smoltz for eight innings, but didn’t stop there. The right hander also shutdown the Braves in the ninth and then the tenth as well, giving his team a chance to squeak across a run and lay claim to victory in one of the most exciting World Series ever played.

By several measures, Morris’ epic game 7 stands out among all other sudden death games. Not only was the right hander the only pitcher to complete 10 innings under the pressure of a winner-take-all scenario, but he also recorded the highest WPA and second highest game score (a mark of 84 bettered only by Sandy Koufax’ 2-0 victory over the Twins in the 1965 World Series). In some people’s mind, on the basis of that game alone, Morris is deserving of enshrinement in the Hall of Fame. Although that point is debatable, what can’t be doubted is the inedible place Jack Morris holds in baseball’s long postseason history.

Top-10 Sudden Death Games by a Pitcher, Ranked by WPA

Source: Baseball-reference.com

For some, sudden death is about more than one moment. Legendary players like Mickey Mantle, Reggie Jackson, Yogi Berra, and Derek Jeter have all had several opportunities to play in October finales, and usually done quite well. However, all of those immortals still take a back seat to a very unlikely legend of the Fall.

Tony Womack’s career OPS+ of 72 is one of the lowest in baseball history among players with a similar number of at bats. At .212/.250/.276, his entire postseason record isn’t much better. And yet, despite his overall futility, the speedy Womack maintains the highest cumulative WPA among all hitters in sudden death games. Even though Luis Gonzalez’ blooper over a drawn-in infield is most often replayed, it was Womack’s game tying double off Mariano Rivera that defined the Diamondbacks’ clinching rally. Considering the relative ability of the two participants, Womack’s hit off Rivera could be the most improbable outcome in postseason history.

Top-10 “Clutch” Offensive Performers in Sudden Death, Ranked by Cumulative WPA

Source: Baseball-reference.com

Although WPA does a good job highlighting the most significant events during a game, it can obscure overall performance by penalizing a player for limiting his leverage by contributing earlier in the game. Using OPS as a barometer, the list of top performers in winner-take-all games looks much more reassuring. Led by Jason Giambi, this group includes several names often associated with clutch performances, which is probably how they earned their reputations in the first place.

Top-10 Offensive Performers in Sudden Death, Ranked by Cumulative OPS

Note: Minimum of 15 plate appearances.
Source: Baseball-reference.com

As previously mentioned, Jack Morris’ only foray into October sudden death was epic. Based on those 10 innings alone, the Twins’ right hander has the highest winner-take-all WPA among pitchers. Not surprisingly, Morris’ mound opponent that game, John Smoltz, ranks third. In three starts and one relief appearance, Smoltz compiled a WPA of .705 and miniscule ERA of .740 in 24 1/3 innings. Only Bob Gibson (2-1 in three games and 27 innings) and Roger Clemens (1-1 in five games and 26 2/3 innings) logged more face time in these crucial games, but their respective ERAs of 3.67 and 4.05 pale in comparison to Smoltz’ stinginess.

Top-10 “Clutch” Pitchers in Sudden Death, Ranked by Cumulative WPA

Source: Baseball-reference.com

As any red blooded player will tell you, individual performance always takes a back seat to the outcome of the game. Devon White probably doesn’t lose much sleep over his 0-6 in the seventh game of the 1997 World Series because the Marlins won the World Series anyway. Similarly, Jim Thome likely doesn’t take much pride in being one of only six players to hit two home runs in a sudden death game because his Indians lost the 1999 ALDS to the Red Sox. That’s why it’s always better to have a ring than a record in October.

No team has won, and lost, more winner-take-all games than the Yankees, who have gone 11-10 in deciding postseason games. Fans of the Bronx Bombers might be happy to know that the Tigers are 2-4. If Cardinals’ fans are looking for a good omen heading into tomorrow’s game 5 NLDS showdown with the Phillies, their team has gone 10-5 when push has come to shove. The Diamondbacks have also had some success in sudden death, winning both times they appeared in such a game, but this time around they won’t have Tony Womack to save the day.

Team Records in Sudden Death Games, By Series

Source: Baseball-reference.com

With three sudden death games on tap, it’s likely that some new postseason heroes, and perhaps a few goats, will be born. However, the real winner is major league baseball, which, fresh off a historic regular season end, seems poised for an epic postseason. Over the next two days. it’ll be winner take all, and six team are going all-in.

Color By Numbers: October Men

In the franchise’s 111-year history, the Yankees have made the post season in 50 seasons, including 27 championships, 40 pennants, and 46 division titles. The Bronx Bombers have also punched their ticket to the playoffs in 16 of the past 17 seasons. No wonder so many Yankees’ fans consider October baseball to be a birthright. However, surviving the 162-game marathon isn’t easy. Just ask the Boston Red Sox. So, in honor of the team’s prolific post season record, a breakdown of all 254 October games is provided below.

Yankees All-Time Post Season Record, by Opponent

W L T W% Series W Series  L Longest WStrk Longest LStrk
Chicago Cubs 8 0 1.000 2 0 8 0
San Diego Padres 4 0 1.000 1 0 4 0
Texas Rangers 11 5 0.688 3 1 10 3
Minnesota Twins 12 2 0.857 4 0 9 1
Atlanta Braves 8 2 0.800 2 0 8 2
Baltimore Orioles 4 1 0.800 1 0 3 1
New York Mets 4 1 0.800 1 0 2 1
Philadelphia Phillies 8 2 0.800 2 0 4 1
Oakland Athletics 9 4 0.692 3 0 3 2
Pittsburgh Pirates 7 4 0.636 1 1 4 2
Seattle Mariners 10 6 0.625 2 1 3 4
Cincinnati Reds 8 5 0.615 2 1 5 4
Brooklyn Dodgers 27 17 0.614 6 1 5 3
Milwaukee Brewers 3 2 0.600 1 0 2 2
Boston Red Sox 11 8 0.579 2 1 4 4
San Francisco Giants 4 3 0.571 1 0 1 1
New York Giants 19 16 1 0.543 4 2 4 8
St. Louis Cardinals 15 13 0.536 2 3 5 4
Kansas City Royals 9 8 0.529 3 1 3 3
Milwaukee Braves 7 7 0.500 1 1 3 3
Anaheim Angels 7 8 0.467 1 2 2 3
Cleveland Indians 7 8 0.467 1 2 3 2
Los Angeles Dodgers 10 12 0.455 2 2 6 4
Arizona D’backs 3 4 0.429 0 1 3 2
Florida Marlins 2 4 0.333 0 1 2 3
Detroit Tigers 1 3 0.250 0 1 1 3

Source: Baseball-reference.com

Yankees All-Time Post Season Record, by Series

W L T W% Game WStrk Game LStrk Series W Series   L Series WStrk Series LStrk
ALDS 39 27 0 0.591 6 (2x) 4 (2x) 10 6 4 3
ALCS 45 28 0 0.616 5 4 11 3 7 1
WS 134 90 1 0.596 14 8 27 13 8 2 (2x)
Total 218 145 1 0.599 12 (2x) 8 48 22 11 4

Source: Baseball-reference.com

World Series Record, By Game

W L T Pct
Game 1 24 16 0.600
Game 2 23 16 1 0.575
Game 3 26 14 0.650
Game 4 24 16 0.600
Game 5 18 12 0.600
Game 6 14 8 0.636
Game 7 5 7 0.417
Game 8 0 1 0.000

Source: Baseball-reference.com

American League Playoff Record, By Game

ALCS ALDS
W L Pct W L Pct
Game 1 10 4 0.714 Game 1 10 6 0.625
Game 2 8 6 0.571 Game 2 10 6 0.625
Game 3 7 7 0.500 Game 3 11 5 0.688
Game 4 8 4 0.667 Game 4 5 7 0.417
Game 5 8 3 0.727 Game 5 3 3 0.500
Game 6 3 3 0.500
Game 7 1 1 0.500

Source: Baseball-reference.com

Total Post Season Record, By Game

W L T Pct
Game 1 44 26 0.629
Game 2 41 28 1 0.586
Game 3 44 26 0.629
Game 4 37 27 0.578
Game 5 29 18 0.617
Game 6 17 11 0.607
Game 7 6 8 0.429
Game 8 0 1 0.000

Source: Baseball-reference.com

  • The Diamondbacks, Marlins and Tigers are the only teams against whom the Yankees have not won a post season series.
  • The Cardinals are the only team to have won more World Series than they lost against the Yankees.
  • The Yankees are 11-3 in “Subway Series”.
  • The Yankees have never faced the Rays, Blue Jays, White Sox, Nationals/Expos, Astros and Rockies in the post season.
  • The Yankees longest post season losing streak was eight games, suffered at the hands of the New York Giants from game 6 of the 1921 World Series until Game 1 of the 1923 World Series.
  • The Yankees longest winning streak in the World Series is 14 games, beginning in game 3 of the 1996 World Series and last until game 3 of the 2000 World Series.
  • The Yankees record for most consecutive post season wins is 12 games, which was accomplished twice:1927, 28 and 36 World Series as well as Game 4 of the 1998 ALCS through Game 2 of the 1999 ALCS.
  • The Yankees won a record 11 post season series, beginning with the 1998 ALDS and ending with the 2001 World Series. From 1927 to 1941, the Yankees won all eight of the World Series in which they played. The record for most World Series victories in consecutive years is five, established by the 1949-1953 Yankees.
  • The only Yankee to ever win two post season MVP awards is Mariano Rivera, who earned the hardware in the 1999 World Series and 2003 ALCS.
  • The Yankees post season winning percentage of .599 is better than the team’s regular season winning percentage of .568, as of the end of the 2011 season.
Older posts           
feed Share on Facebook Share on Twitter Share via email
"This ain't football. We do this every day."
--Earl Weaver